


How to Investigate Server Load: Part 2
Introduction
In this second tutorial on server load, we outline the steps that should be taken when investigating where server load originates and what may be causing your server to become overloaded. As noted in Part 1of our series, excessive use of any apps or services can typically cause load issues. Here are the four main areas of concern:
- CPU
- Memory (including swap)
- Disk I/O
- Networking
Historical Load
Typically, when troubleshooting server load, we are notified of a high load error or receive an email informing us about an event that has already passed. Unless an admin can log in while the load is occurring, trying to pin down where the load originated is difficult. With that being said, there are several tools we can use to identify the timeframe and load averages that occurred during a load occurrence. The first step uses the sar -q command to locate the timeframe in which the load occurred.
SAR Command
Using the sar command specifically, we can review the past load history to pin down when it experienced an elevated server load. If we see a pattern of high load times, say between 1:00 am, and 2:00 am on the 22nd of the month, we can move forward and use the sar command to view load between the times noted. Below is the example output of the sar command using the - q flag.
root@host [~]# sar -q -f /The command’s full output is shown from 12:00:01 AM to 11:50:01 PM for the 22nd of January. It should be noted that the sar logs rotate out each month and overwrite the log from a month prior.The sar command also can review CPU, memory, swap, and I/O data using various flags.
Current Load
If an admin can log in right away, several of the tools noted below are excellent at deducing high server load.
HTOP
This command is an interactive process-viewer, process-manager, and system-monitor designed as an alternative to the top command. To install it, we use the command below.
root@host [~]# yum install htopTo view the current statistics, simply run the htop command.
Using the menu, we can sort, filter, and search for information broken down by multiple factors, including PID, user, priority, state, time, and the percentage of CPU and memory being used. Assuming the load is not too high, this is an excellent tool we can use to locate and stop a high load in its tracks.
PCP/Dstat
In a prior knowledge base article, we reviewed PCP or Performance Co-Pilot. PCP is an assessment and evaluation tool previously known as Dstat. It is used to collect a wide range of server metrics while examining current and prior operational data. As a side note, Dstat was renamed to PCP after RedHat took it over. Dstat was a versatile replacement for the following Linux toolsets:
- vmstat
- Iostat
- netstat
- ifstat
RedHat also added additional features like more counters and increased flexibility over those older tools. To install PCP, visit the PCP homepage tool. An additional feature of dstat is the ability to run a cron of a dstat command to take a snapshot of your server's processes every X seconds/minutes. It then allows us to record that info into a .csv format, which we can download and import later into excel or google sheets for review.
Solving High Load Issues
We can break down the high server load issue once we determine where the load originates.
CPU
Typically, issues revolving around a high CPU load indicate that we need additional cores to handle the system's extra workload. The other cause we can address is working with the application to either optimize or reduce the application usage or horizontally scale the application. As noted in Part 1, some of the common causes of increased CPU usage are as follows:
- PHP scripts
- Multiple background processes
- Malformed MySQL queries
- Apache processes
Here is a command we can use to gather information about CPU processes and queue usage.
root@host [~]# resize; clear; date; echo "Top 10 Processes";This command provides output like so.
Wed Jan 27 14:26:50 EST 2021
Top 10 Processes
USER %CPU %MEM RSZ COMMAND
mysql 0.3% 3.9% 146 MB /usrPHP
If a PHP script is over-utilized or not coded well, it will cause an excessive CPU load. The script should be reviewed and optimized by a web developer. Generally, these scripts perform a specific function on a website like file manipulation, content management, handling multimedia duties, or other utility roles used to improve the website’s usability or functionality.
Apache/Background Processes
Background processes like malware scans or increased Apache processes can have a severe impact on available resources. If enough of these processes occur simultaneously, the available RAM is consumed, and the server begins running into swap issues. To solve this, a user should identify the specific processes related to the increased load using a command like this to find Apache’s top requests.
root@host [~]# cut -d' ' -f7 /Next, we can also check if the website is being hit by too many requests from an IP address.
root@host [~]# cut -d' ' -f1 /usr/Too many connections may indicate a bot, web scraper, or someone just hitting the site too often.
Lastly, here is a command which shows us the top ten memory utilization processes (with children aggregate).
root@host [~]# ps axo rss,MySQL
Malformed MySQL queries can also have a significant impact on load. If a user is interacting with a website trying to pull specific information from an existing database, backed up MySQL processes will delay that data's return. If enough of those processes run concurrently, it will force the load higher. Using the mysqladmin processlist command will help identify the current workload of MySQL.
root@host [~]# mysqladmin processlist
+--------+
| Id  | User | Host | db | Command | Time | State | Info | Progress |
+--------+
| 1   | system user |    | Daemon  | InnoDB purge worker      | 0.000    |
| 2   | system user |    | Daemon  | InnoDB purge coordinator | 0.000    |
| 4   | system user |    | Daemon  | InnoDB purge worker      | 0.000    |
| 3   | system user |    | Daemon  | InnoDB purge worker      | 0.000    |
| 5   | system user |    | Daemon  | InnoDB shutdown handler  | 0.000    |
Another tool that is useful for identifying load from MySQL is Mytop. Mytop is an open-source, command-line tool used for monitoring MySQL performance. It is a clone of the top command and features a terminal-based interface to monitor the overall performance of MySQL. Using this method, we can see how queries from a database are performing.
Once the malformed queries are located, we can then have a developer adjust them to run more efficiently. Otherwise, they should be rewritten or removed if they are a primary cause of load.
Memory
Locating the cause of high load related to memory or RAM consumption can be difficult without the proper tools and information. Luckily, we can use commands like this to identify a memory usage overview using the terminal.
The output of this command looks like this.
Wed Jan 27 14:43:31 EST 2021
awk: cmd. line:1: BEGIN {FS=" "}{printf \A more exhaustive command that shows memory usage can be seen here.
The nicely formatted output is below.
== Server Time: ==
2021-01-27 02:50:06 PM
== Memory Utilization Information: ==
Total Memory Active Memory Percentage Used
3678M 0M 0.00%
== Current Swap Usage: ==
DEVICE USED TOTAL PERCENT USED
/dev/vda2 1499.74M 2000.00M 74.99%
== Top 10 Processes by Memory Usage: ==
USER PID %MEM RSZ COMMANDroot 2215 14.9 563148 Granted, this is a massive amount of output data, but having tools like this only serves to bolster our overall memory usage view.
Disk I/O
In searching for load issues caused by disk I/O, access time is the driving factor. Disk I/O is the input/output operation on a physical disk drive. If the server reads or writes data to or from a disk file, the processor waits for the file to be written or read. Since older hard drives tend to be mechanical, the server waits to rotate to the disk to the required disk sector.
Typically, the easiest method to observe high disk I/O throughput is to use the iotop command. Running this provides an easy readout displaying where disk I/O may be originating.
Total DISK READ : 0.00 B/s | Total DISK WRITE : 0.00 B/s
Actual DISK READ: 0.00 B/s | Actual DISK WRITE: 0.00 B/s
TID PRIO USER DISK READ DISK WRITE SWAPIN IO> COMMAND
1 be/4 root 0.00 B/s 0.00 B/s 0.00 % 0.00 % systemd Another commandline tool that can show disk I/O is atop. The command atop provides a more comprehensive view of the hardware.
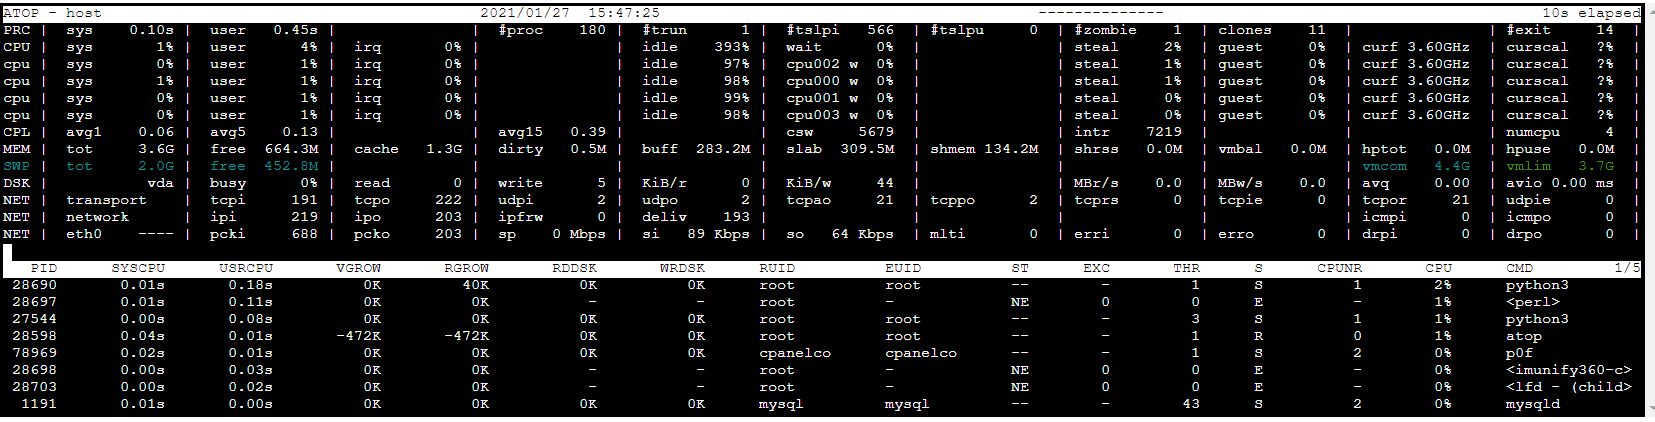
If looking at the DSK row, we can see the following info.
DSK | vda | busy 0% | read 0 | write 5 | KiB/r 0 | KiB/w 33 | MBr/s 0.0 | MBw/s 0.0 | avq 1.00 | avio 0.20 msOne final command that indicates I/O usage can be seen here.
root@host [~]# dd if=/dev/zero of=diskbench bs=1M count=1024 conv=fdatasync
1024+0 records in
1024+0 records out
1073741824 bytes (1.1 GB) copied, 2.57465 s, 417 MB/s
root@host [~]#
This command does an actual read/write check of the disk to measure throughput. It sends/receives one GB of data to the disk and then calculates the speed and how fast it was transferred. In this case, it moved 417MB/s.
To address load caused by I/O wait, we must lower the number of read/writes, modify our configurations that utilize I/O (like mysql), or use a faster disk drive. Modern SSD drives reduce this issue significantly. More advanced techniques can be used but require a developer or systems administrator to implement.
Networking
Typically, only a few factors define load caused by networking issues. These include network saturation, incorrectly configured networking protocols, and malicious traffic.
Symptoms of network saturation include, but are not limited to, dropped packets, unreachable websites, and increased server load (from trying to digest the influx of inbound traffic). Additionally, suppose a web application firewall or software firewall is in place, and firewall rules are misconfigured (such as trying to block a significant number of IPs from multiple countries). In that case, the load can occur due to the increased workload from that application.
With the rise in streaming, running multiple large video streams from a site can also cause stress the outbound network connections. This stress can reduce the overall flow of traffic, increasing load considerably.
IPTraf
One of the tools we can use to examine the amount of traffic we are receiving is IPTraf.
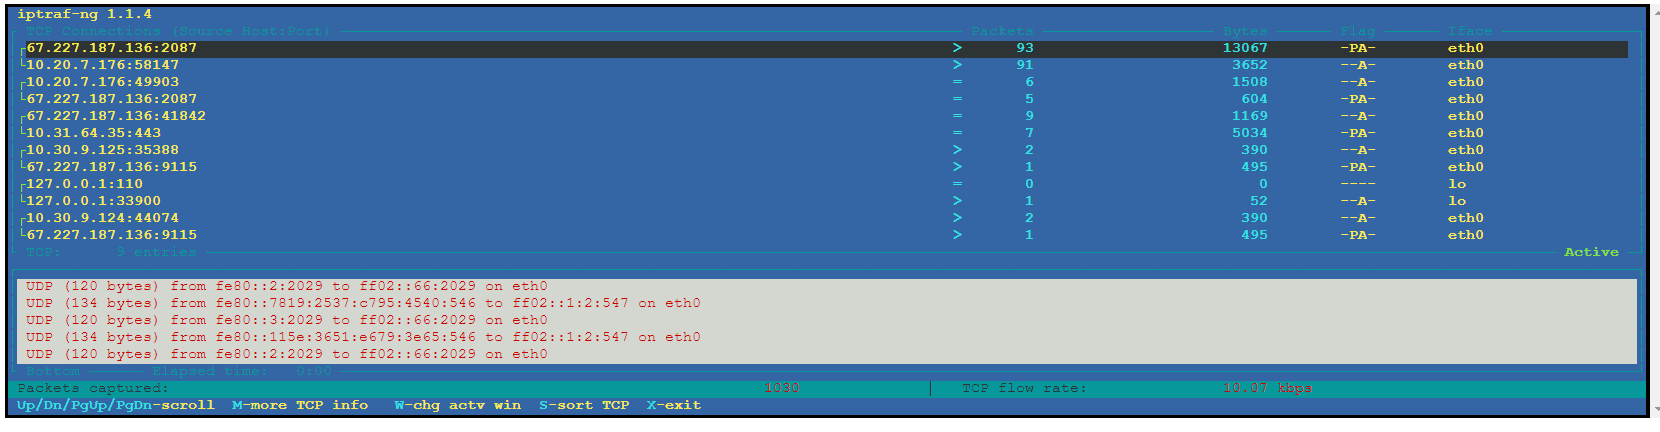
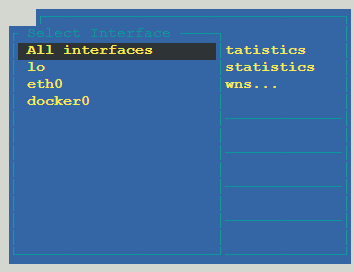
The iptraf-ng command brings up a graphical interface that allows us to select multiple options for viewing the network connections. In the menu, first, select IP traffic monitor and then All interfaces to show all traffic on eth0, lo, docker, and other available interfaces.
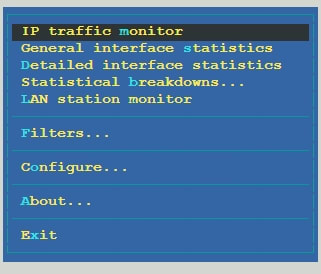
When selecting “General interface statistics,” we see the following info.
iptraf-ng 1.1.4
┌ Iface ── Total ── IPv4 ── IPv6 ── NonIP ── BadIP ── Activity
│ lo       68       68      0       0        0        6.98 kbps
│ eth0     541      507     34      0        0        23.22 kbps
│ docker0  0        0       0       0        0        0.00 kbps
────────────
─────────
When selecting “Statistical breakdowns,” we see this information.
iptraf-ng 1.1.4
┌ Proto/Port ─ Pkts ─ Bytes ─ PktsTo ─ BytesTo ─ PktsFrom ─ BytesFrom
│ TCP/443       528    226088  289     109761     239       116327
│ UDP/53        6      563     3       204        3         359                                                              │
 TCP/80        22     2475    13      1289       9         1186
│ UDP/546       6      820     0       0          6         820
│ UDP/547       6      820     6       820        0         0
│ TCP/21        18     586     10      488        8         1098
│ TCP/110       16     904     10      536        6         368
This tool provides a unique view of the amount of traffic moving in and out of the server. It can help us track down networking backups based on the amount of traffic we are receiving on which interface and port.
To lower the load caused by these issues, we must lower or limit the type or amount of traffic. We must also ensure that our network configurations are not contributing to this issue.
Conclusion
A server will always have a slight load, which is expected. Linux can control most load concerns, but we must step in when needed to locate and lower high load issues. The tools above provide a solid base for tracking download problems no matter where it originates.
We pride ourselves on being The Most Helpful Humans In Hosting™!
Our technical support staff is always available to assist with any issues related to this article, 24 hours a day, 7 days a week 365 days a year.
We are available, via our ticketing systems at support@liquidweb.com, by phone (at 800-580-4986) or via a LiveChat or whatever method you prefer. We work hard for you so you can relax.
Related Articles:


About the Author: David Singer
I am a g33k, Linux blogger, developer, student, and former Tech Writer for Liquidweb.com. My passion for all things tech drives my hunt for all the coolz. I often need a vacation after I get back from vacation....


Our Sales and Support teams are available 24 hours by phone or e-mail to assist.
Latest Articles
Email security best practices for using SPF, DKIM, and DMARC
Read ArticleLinux dos2unix command syntax — removing hidden Windows characters from files
Read ArticleHow to use kill commands in Linux
Read ArticleChange cPanel password from WebHost Manager (WHM)
Read ArticleChange cPanel password from WebHost Manager (WHM)
Read Article