
 Ross Chesley
 When running MSSQL or Microsoft SQL Server, we need to determine whether it is optimized or will it need more resources to achieve better performance. This article reviews what behaviors to look for, where to find them, and how to view signs of distress.
Resource Factors To Consider
Before we get started finding resource usage details, let’s look at the four key resources MSSQL relies on:
- CPU/processor
- RAM/memory
- Disk I/O
- Network I/O

Because Microsoft SQL Server runs on an operating system with finite resources, we need to be certain we have allocated enough CPU, Memory, Disk space and Network resources to run MSSQL, the operating system, and other software installed on the system. Restricting system reserves will cause other software to compete with MSSQL for resources, and that will negatively affect the system’s overall performance.
Let’s look at how each resource affects the performance of the system and MSSQL in particular:
CPU/Processor
This is the main component in the system that determines the speed at which it can orchestrate the other components to process tasks for the operating system and applications including MSSQL. If you have a slow processor, a single processor, or insufficient cores, your system can perform sluggishly. In general, the more CPUs, cores, and faster clock speeds allow for better performance which makes the system run faster.
Memory
This is the second most important component in the system to determine overall performance. If there is not enough memory to run the operating system and all of the other programs and applications, the operating system will fall back to utilizing virtual memory to swap memory contents to disk storage. Paging slows down the system performance but allows it to work with more elements than could normally fit in memory. While having virtual memory is more advisable than running out of memory, it always lowers performance and is less than ideal. Generally, the more memory you have, the better the system can perform.
Disk Drives
Hard Disks are used for the storage of data that cannot fit into memory. Since most system’s memory cannot hold terabytes of data, we rely on hard disk drives (HDDs) or solid-state drives (SSDs) to provide an improved means of storage and moving content in and out of memory. The speed of the drives (when transferring data to/from memory to disk) is a serious performance consideration. HDDs are typically slower and have a larger capacity than SSDs. SSDs are faster and have the advantage of no moving parts. In general, the HDDs have a larger capacity, SSDs are faster, and both can be set up in a configuration designed to enhance the performance and reliability of the system.
Networks
Networks are the way clients connect to the server to send and receive data from MSSQL. If SQL queries require large network data transfers, or there are many client connections, it can slow down the system. Think about networks as a pipe that data flows through. It is faster to move lots of data through a bigger pipe, however, the cost increases as the pipe gets larger. With MSSQL, we first look for ways to optimize the queries and then consider whether a stored procedure could execute on the server rather than pulling all the data across the network to be processed on the client-side.
Performance Problems In MSSQL
Performance problems in MSSQL can be traced back to issues in one or more of the four main resources (CPU, Memory, Disk, Network). Here are a few examples of how each resource can affect the performance of others.
- Adding more memory reduces the activity of the CPU and disk resources if the performance issue is due to insufficient memory creating excessive paging.
- Adding more memory also allows MSSQL to store more data without having to page it. Additionally, increasing to a faster storage medium can improve the performance of the system, allowing for faster movement of data. This will also allow the processor and memory to work more efficiently for all tasks including MSSQL.
- In most database applications, the most intensive processes involve reading stored data into memory, modifying the data in memory, and rewriting the data back to the disk. Most systems will not have enough memory to read multiple large databases entirely into memory as they rely on paging to disk. Adding memory and disk storage are improved methods to increase the performance of MSSQL.
- Adding more or faster CPUs will enable the system to handle the workload more efficiently. If a slower processor is not able to effectively complete assigned tasks, it will cause bottlenecks in response to queries and may delay transferring data.
Obtain Resource Usage
Now that we understand how resources can affect MSSQL performance, we can look at three ways to get resource usage information
- Task Manager, Performance tab
- Resource Monitor
- SQL Server Management Studio (SSMS) Reports and Queries
You may want to explore Task Manager, Resource Monitor, and SQL Server Management Studio for more detail via the Knowledge Base articles noted below.
Task Manager

To start Task Manager, click the Start menu and type task, then choose Task Manager from the results.
The Performance tab is where we will get a quick overview of how MSSQL and the system as a whole are utilizing the CPU, Memory, and Network. Keep in mind, the graph only shows what is happening over a one minute period of time. Monitoring system performance during a period of time when we think there may be issues can show spikes and/or trends which can help us determine if resources are sustained at a high level, or whether the issue is temporary.
CPU
The CPU information provides us with the number of cores, the type, speed, and the number of active processors. The main information we want to check is to see if the CPU is constantly running above 90%. This means the system may not be able to keep up with resource demands, which will cause the system to slow down.
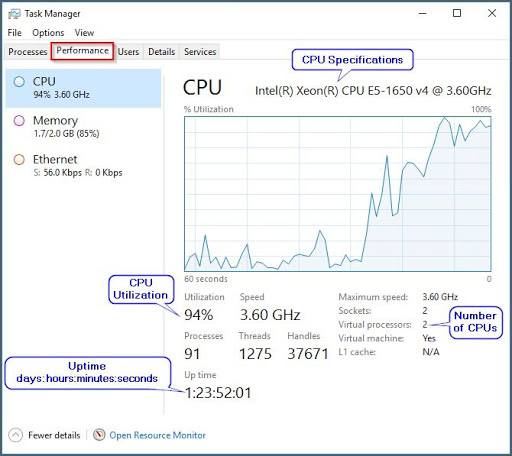
Memory
This gives us the total amount of memory on the system, what is currently being used, and the available remaining memory. The committed value shows virtual memory and pagefile on disk. Cached shows what is in use, and Paged pool is pageable kernel memory that can be paged out to disk when the memory starts running low.

Ethernet
This shows us the resources a network adapter is using. The line in the graph shows the send and receive throughput. If we are seeing very high throughput, this can indicate that MSSQL or another process is pushing a considerable amount of data. This may indicate the need to review and optimize queries. Also, this may indicate the need to examine creating locally stored procedures to execute on the server as opposed to pushing data across the network to run a query on the client-side. Additionally, you can gather even more detailed information by right-clicking on the graph.

Resource Monitor

To start the Resource Monitor, click the Start menu and type resource, then select Resource Monitor. The Resource monitor provides us with more granular detail, broken down by the four key resources we mentioned earlier: CPU, Memory, Disk, and Network.
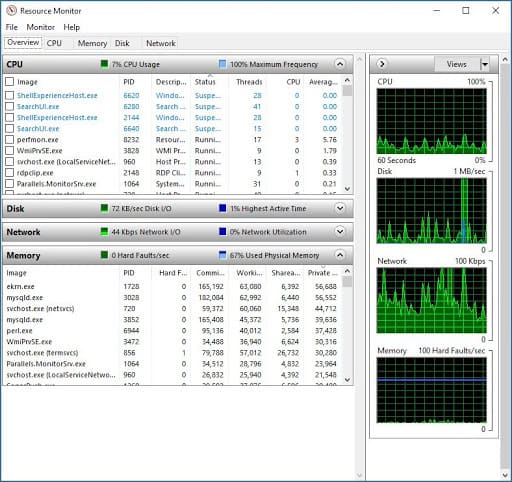
The Overview tab has expanding and collapsing sections to allow for viewing several areas at the same time as well as sorting options. If you find that MSSQL is high on the list for CPU, Memory, Disk, and Network and resources are at or above 90% on a sustained basis, it is a good indicator that the performance of the system is suffering and could benefit from optimization and/or hardware upgrades.
Clicking on the individual resource tabs will provide see full details on each resource independent of the others.
Microsoft SQL Server Management Studio
When we start SSMS, we connect to the MSSQL server. If we are accessing the server locally, we can use localhost or the servers name. If we are accessing it from a remote system or network, we will use the IP address to connect.

Object Explorer
Once SSMS is open, we can run reports to gain helpful information about how MSSQL is utilizing its resources. In the Object Explorer, Right-click the Server name at the top and choose Reports. Some of the reports that are used most often are available directly off the Reports Menu while others are available from Standard Reports.
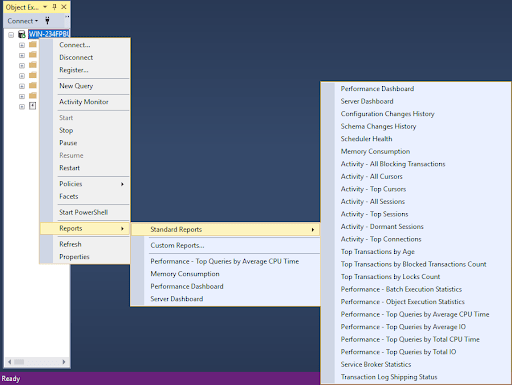
Let’s look at some of the options we have available to get more resource information.
MSSQL Performance Dashboard
This report will show the System CPU Utilization specific to SQL and other (other than MSSQL). This is helpful when we need to see how much CPU SQL is actually using. You can also see current user requests and sessions with memory cache hit ratio, as well as access expensive queries and other useful information.

MSSQL Memory Consumption
This report will show memory consumption specific to SQL, including page life expectancy and Top Memory Consuming Components to visualize how much memory SQL is using.

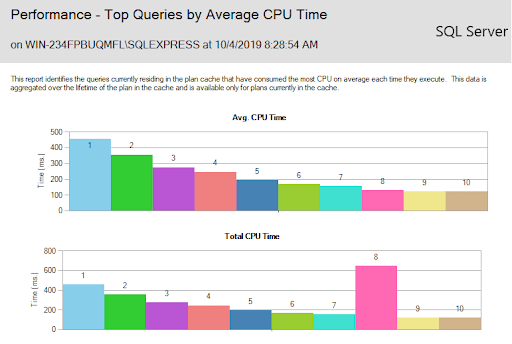
MSSQL Performance – Top Queries by Average CPU Time
This report will show the top 10 queries with Average CPU Time and Total CPU Time. Additional information is also presented that can help identify queries that may benefit from optimization.
MSSQL Expensive Queries using Transact SQL (T-SQL)
You can customize a report and get more details on expensive queries by running them in SSMS. Here are a few links that will provide more information on T-SQL statements for Expensive Queries:
To start a New Query, click the New Query option from the menu.

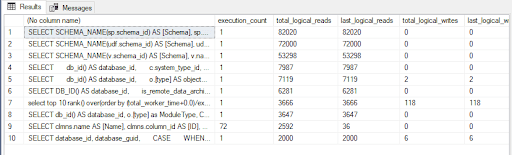
Using one of the query statements available from the links, copy and paste or type a query into the query statement window, and then click Execute to run the query and produce results:

Here are the results for the above query:
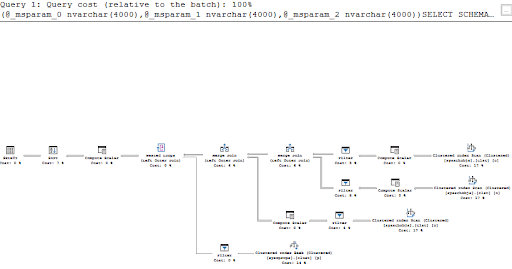
You can scroll to the right and click a link to show the query plan in a layout view that breaks the cost down by each component.
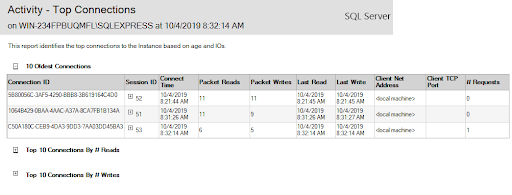
MSSQL Activity – Top Connections
This report will give an idea of how many connections your MSSQL Server has. You can also see the Top 10 connections by the number of Reads and Number of Writes. This is helpful when you need to see how much data is being moved over the network connection.
Conclusion
In this article, we learned to identify the four key resources that affect MSSQL. We discovered how to check the system for resource usage using the Task Manager Performance tab, the Resource Monitor, and SSMS Reports and queries. You should now have a better understanding of how to use this information to evaluate the performance of your server and identify potential performance bottlenecks to determine the best way to resolve them.
Talks To An Expert Now!
MSSQL optimization can be a difficult undertaking. Luckily, Liquid Web has experts standing by 24 hours a day to assist with this effort. We have the expertise in house to enhance the stability of your servers and fine tune your configurations to provide a better foundation for your websites. Our professional technicians can step in at any time to take over for you if problems or issues crop up.