
The web-based Kubernetes console is an interface that provides information about the state of the Kubernetes cluster. The dashboard is also used for deploying containerized applications as well as for general cluster resource management. Traditionally, kubectl is primarily used in the terminal for nearly all cluster related tasks. Still, it is useful to have a visual representation of our cluster in a user-friendly interface. To install the dashboard, kubectl needs to be installed and running on the server.
Deploy Kubernetes Dashboard
First, we will deploy the k8s dashboard using the kubectl command in the terminal.
root@host:~# kubectl apply -f https://raw.githubusercontent.com/kubernetes/dashboard/v2.0.0/aio/deploy/recommended.yaml
namespace/kubernetes-dashboard created
serviceaccount/kubernetes-dashboard created
service/kubernetes-dashboard created
secret/kubernetes-dashboard-certs created
secret/kubernetes-dashboard-csrf created
secret/kubernetes-dashboard-key-holder created
configmap/kubernetes-dashboard-settings created
role.rbac.authorization.k8s.io/kubernetes-dashboard created
clusterrole.rbac.authorization.k8s.io/kubernetes-dashboard created
rolebinding.rbac.authorization.k8s.io/kubernetes-dashboard created
clusterrolebinding.rbac.authorization.k8s.io/kubernetes-dashboard created
deployment.apps/kubernetes-dashboard created
service/dashboard-metrics-scraper created
deployment.apps/dashboard-metrics-scraper created
root@host:~#
Import Default Configuration
Next, we will download a default configuration to our server.
root@host:~# wget https://raw.githubusercontent.com/kubernetes/dashboard/master/aio/deploy/recommended.yaml
--2020-10-23 22:41:43-- https://raw.githubusercontent.com/kubernetes/dashboard/master/aio/deploy/recommended.yaml
Resolving raw.githubusercontent.com (raw.githubusercontent.com)... 151.101.112.133
Connecting to raw.githubusercontent.com (raw.githubusercontent.com)|151.101.112.133|:443... connected.
HTTP request sent, awaiting response... 200 OK
Length: 7552 (7.4K) [text/plain]
Saving to: 'recommended.yaml'

recommended.yaml 100%[======================>] 7.38K --.-KB/s    in 0s

2020-10-23 22:41:44 (22.5 MB/s) - 'recommended.yaml' saved [7552/7552]
root@host:~#
Reconfigure
We will replace the default configuration file with the one we have just downloaded, edit it, and then apply the specific changes unique to our settings.
root@host:~# mv recommended.yaml kubernetes-dashboard-deployment.yml
root@host:~#
Now, we should edit the configuration file and enter the following settings.
root@host:~# vim kubernetes-dashboard-deployment.ymlkind: Service
apiVersion: v1
metadata:
labels:
k8s-app: kubernetes-dashboard
name: kubernetes-dashboard
namespace: kubernetes-dashboard
spec:
ports:
- port: 443
targetPort: 8443
selector:
k8s-app: kubernetes-dashboard
type: NodePortThe NodePort setting provides a Service on each host IP address on a static port. The default is ClusterIP, a service in which NodePort Service routes are automatically created.
Lastly, save and exit the file using the :wq command in vim.
Apply Changes
To apply our changes, we will use the kubectl apply command to implement the previous modifications we made to our configuration. This effectively locks in our updates, which are then applied to our existing system.
root@host:~# kubectl apply -f kubernetes-dashboard-deployment.yml
service/kubernetes-dashboard unchanged
serviceaccount/kubernetes-dashboard unchanged
secret/kubernetes-dashboard-certs unchanged
secret/kubernetes-dashboard-csrf unchanged
secret/kubernetes-dashboard-key-holder unchanged
configmap/kubernetes-dashboard-settings unchanged
role.rbac.authorization.k8s.io/kubernetes-dashboard unchanged
clusterrole.rbac.authorization.k8s.io/kubernetes-dashboard unchanged
rolebinding.rbac.authorization.k8s.io/kubernetes-dashboard unchanged
clusterrolebinding.rbac.authorization.k8s.io/kubernetes-dashboard unchanged
deployment.apps/kubernetes-dashboard unchanged
service/dashboard-metrics-scraper unchanged
deployment.apps/dashboard-metrics-scraper unchanged
root@host:~#
Verify Status
Now we will check the Dashboard’s creation and deployment status using this command.
root@host:~# kubectl get deployments -n kubernetes-dashboard
NAME READY UP-TO-DATE AVAILABLE AGE
dashboard-metrics-scraper 1/1 1 1 10m
kubernetes-dashboard 1/1 1 1 10m
root@host:~#
Create Modules
Next, we will create two modules; one for the dashboard and one for the metrics. The dash n (-n) flag represents a namespace.
root@host:~# kubectl get pods -n kubernetes-dashboard
NAME READY STATUS RESTARTS AGE
dashboard-metrics-scraper-5997fdc798-7jr2t 1/1 Running 0 11m
kubernetes-dashboard-665f4c5ff-qb7sg 1/1 Running 0 11m
root@host:~#
Check Service
Now we can check the NodePort service that we modified earlier. Notice the kubectl get command now defines ‘services,’ which includes the nodeport IP’s.
root@host:~# kubectl get services -n kubernetes-dashboard
NAME TYPE CLUSTER-IP EXTERNAL-IP PORT(S) AGE
dashboard-metrics-scraper ClusterIP 10.96.25.69 <none> 8000/TCP 12m
kubernetes-dashboard NodePort 10.98.129.73 <none> 443:30741/TCP 12m
root@host:~#
To use the Kubernetes Dashboard, we need to create an administrator user. The admin user can modify objects in all namespaces and manage any components of the cluster.
Create Manifest File
First, we will create a service account manifest file in which we will define the administrative user for kube-admin and the associated namespace they have access to.
root@host:~# vim admin-sa.ymlNext, we add the following information to the Yaml file and apply it using the kubectl apply command.
apiVersion: v1
kind: ServiceAccount
metadata:
  name: kube-admin
  namespace: kube-system
This command applies the specific settings.
root@host:~# kubectl apply -f admin-sa.yml
serviceaccount/kube-admin created
root@host:~#
Next, we will bind the cluster-admin role to the created user.
root@host:~# vim admin-rbac.ymlOnce the file is open in vim, enter the following information.
apiVersion: rbac.authorization.k8s.io/v1
kind: ClusterRoleBinding
metadata:
  name: kube-admin
roleRef:
  apiGroup: rbac.authorization.k8s.io
  kind: ClusterRole
  name: cluster-admin
subjects:
  - kind: ServiceAccount
    name: kube-admin
    namespace: kube-system
Save the file using the :wq command in vim and apply the changes to the file.
root@host:~# kubectl apply -f admin-rbac.yml
clusterrolebinding.rbac.authorization.k8s.io/kube-admin created
root@host:~#
Set Variable
In this step, we store the specific name of the service account.
root@host:~# SA_NAME="kube-admin"Now we will generate a token for the account. This is necessary for security and further employment of the user in other systems, namespaces, or clusters.
root@host:~# kubectl -n kube-system describe secret $(kubectl -n kube-system get secret | grep ${SA_NAME} | awk '{print $1}')
Name: kube-admin-token-kz7b8
Namespace: kube-system
Labels: <none>
Annotations: kubernetes.io/service-account.name: kube-admin
              kubernetes.io/service-account.uid: c25ac94c-b48e-4bb8-8711-c851fdec9272

Type: kubernetes.io/service-account-token

Data
====
namespace: 11 bytes
token: eyJhbGciOiJSUzI1NiIsImtpZCI6IlAwQnJ0a1dldE1IQWpKSjRERzdZckRYVU9jT2o2N0JhUjBtOWI5Q1pBYzQifQ.eyJpc3MiOiJrdWJlcm5ldGVzL3NlcnZpY2VhY2NvdW50Iiwia3ViZXJuZXRlcy5pby9zZXJ2aWNlYWNjb3VudC9uYW1lc3BhY2UiOiJrdWJlLXN5c3RlbSIsImt1YmVybmV0ZXMuaW8vc2VydmljZWFjY291bnQvc2VjcmV0Lm5hbWUiOiJrdWJlLWFkbWluLXRva2VuLWt6N2I4Iiwia3ViZXJuZXRlcy5pby9zZXJ2aWNlYWNjb3VudC9zZXJ2aWNlLWFjY291bnQubmFtZSI6Imt1YmUtYWRtaW4iLCJrdWJlcm5ldGVzLmlvL3NlcnZpY2VhY2NvdW50L3NlcnZpY2UtYWNjb3VudC51aWQiOiJjMjVhYzk0Yy1iNDhlLTRiYjgtODcxMS1jODUxZmRlYzkyNzIiLCJzdWIiOiJzeXN0ZW06c2VydmljZWFjY291bnQ6a3ViZS1zeXN0ZW06a3ViZS1hZG1pbiJ9.i25cRCwfoK9WKjd9P3rRinRrXnzwkXjfTswFZXZrl9TG3SVOLf4ajgwX8a2VtohVdmkxlt_61ClcbunwFTC-YB0uM6ZT24RPgbQ9Ir7ApbTsR_m7IH_7ElfMuZjCQIXU1wTwmN-vWbqCIwnY0Mz2OptkdA8J_JeahPFJHyjwzBZsKCEVu5xqjPFCQoXRz1whKzuKrjIhRVuV5vp3dc4gV_7vbjaOWfCwscsnPsBvep0DQBcYlMwxxY-OTzH-FjBhRwA2HhofxnmGsx9qlXvYfVwb7oGMZTR0SDGTomb9qcgnP3LjQZDaneN6StGC_02EtDUsh9VrdeOOCV5Tfm5wcQ
ca.crt: 1066 bytes
root@host:~#
We would advise keeping the token as secure as possible. After creating the token, we can finally access the dashboard control panel. Copy the key as we will need it momentarily to access the dashboard.
Access the Dashboard
Before accessing the dashboard, it should be noted that it deploys a minimal RBAC configuration by default and requires a Bearer Token to log in. This is the token we created above. To locate the port and IP address, run this command.
root@host:~# kubectl get service -n kubernetes-dashboard | grep dashboard
dashboard-metrics-scraper ClusterIP 10.96.25.69 <none> 8000/TCP 27m
kubernetes-dashboard NodePort 10.98.129.73 <none> 443:30741/TCP 27m
root@host:~#
In our setup, we used port 30741, as you can see in the second line of output of the previous command. You can log in using this port on any server.
We can also access the dashboard using the following kubectl command.
root@host:~# kubectl proxy
Starting to serve on 127.0.0.1:8001
Open your browser and enter the following URL.
http://localhost:8001/api/v1/namespaces/kubernetes-dashboard/services/https:kubernetes-dashboard:/proxy/.
The Dashboard can ONLY be accessed from the computer where the command is executed when using this method.
Next, enter the token noted above on this screen and click the ‘Sign In‘ button.

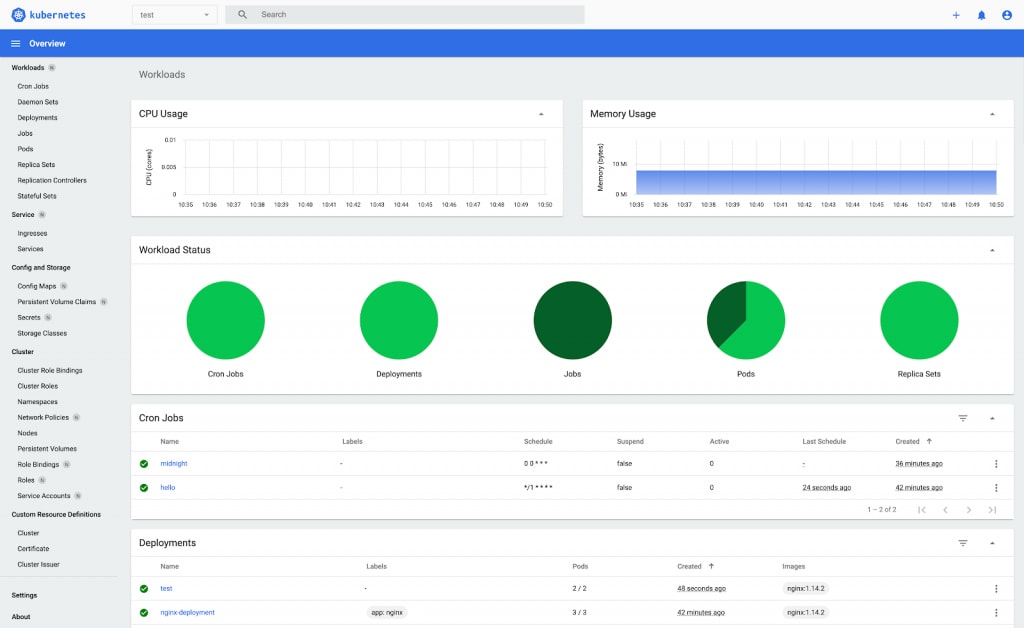
This opens the default dashboard view.

This completes the installation and configuration of the Kubernetes dashboard.
Deploy a Containerized Application
The Dashboard provides other benefits, such as allowing us to create and deploy containerized applications using a simple wizard. You can manually add specific app info or upload a file containing the application’s configuration in either a YAML or JSON format. Click the ‘CREATE‘ button in the upper-right corner of any page to start that process.
Other Features
- Navigation – This view shows Kubernetes objects defined in the default namespace cluster.
- Admin Overview – This screen lists Node, Namespace, and Persistent Volume statuses.
- Workloads – Lists workload by application type running in the chosen namespace.
- Services – This view shows resources exposed either internally or externally.
- Storage – This screen view shows Persistent Volume resource usage by applications.
- Config Maps and Secrets – This view shows cluster resource usage of app configurations. It also allows for editing and configuration management.
- Log viewer – Displays log data from a single selected pod. Below is a screenshot of the Log viewer.

Get Started Today!
We pride ourselves on being The Most Helpful Humans In Hosting™!
Our Support Teams are filled with experienced Linux technicians and talented system administrators who have intimate knowledge of multiple web hosting technologies, especially those discussed in this article.
Should you have any questions regarding this information, we are always available to answer any inquiries with issues related to this article, 24 hours a day, 7 days a week 365 days a year.
If you are a Fully Managed VPS server, Cloud Dedicated, VMWare Private Cloud, Private Parent server, Managed Cloud Servers, or a Dedicated server owner and you are uncomfortable with performing any of the steps outlined, we can be reached via chat, or support ticket to assisting you with this process.