
 Antonia Pollock
 What is ApacheTop?
ApacheTop is an uncomplicated command line (CLI) utility that is used to monitor http traffic in real-time. It achieves this task by analyzing the incoming apache logs and based on that data presents understandable output to our screen. It can be configured to output X number of hits, or output X number of hits within X seconds.
Introduction to ApacheTop
Website owners and administrators oftentimes find themselves interested in the traffic for a specific website or multiple websites on the server. They might need this information in order to troubleshoot a high load issue on the server, or simply to learn the traffic pattern of a website, which is crucial for running a business. This information is logged in the web server’s access logs, and we can look through them to learn about the website’s traffic that has occurred in the past. Parsing through these logs to make most sense of them requires some basic skills in Bash, though, so it is not always very convenient.
However, we might want to learn more about the traffic in real-time in cases of currently high load on the server or issues with a website. In this case, we can use a monitoring tool called ApacheTop, which shows traffic in real-time. Furthermore, it collects the information from the web server’s access log and parses through it so that it generates human-readable output. This way, we can see what pages are being seen on the server in real-time, but we also do not need any Bash skills to parse through the output. It displays the information such as requests per second, bytes per second and URLs that are being requested, and its display is modelled after the standard top utility.
ApacheTop keeps a table of information by containing all the relevant data about the requests it has collected, but it can only be of a certain finite size. By default, it will show the data within the 30-second time frame, but we can define its size in a couple of ways. This can be done by making it remember a certain number of hits, or a certain number of seconds, after which it resets. We should also note that ApacheTop tool uses Apache’s default access log file for the traffic information, however, in case of a custom log path, we can also specify which log file to look through.
Installation
We can install ApacheTop like any other package, but we need to have the EPEL repository installed first.
CentOS Based Systems
yum install epel-release
yum install apachetop
Debian Based Systems
On Debian/Ubuntu based systems, we can use apt-get to install apachetop
apt-get install apachetopUsing ApacheTop
In order to use ApacheTop, we can simply run the command apachetop from the command line. This will, without specifying anything else, by default use the Apache access log and display information within a 30-second timeframe.
Flags
If we want to use a custom log path, we can specify it with the -f flag:
apachetop -f /path/to/the/log/fileIn order to change the default 30 second time range for showing data, we can do so with one of the following flags:
- H – This flag specifies the number of hits we want ApacheTop to display. The following example will show the last 100 hits
apachetop -H 100
- T – This flag specifies the number of seconds for how long ApacheTop will keep track of the data. In the following example, ApacheTop will be showing hits in the last 60 seconds:
apachetop -T 60
Some of the additional flags that we can also use include the following.
- – q – This flag instructs ApacheTop to keep the query strings, instead of removing them
- – l – This flag instructs ApacheTop to use all lowercase URLs, which causes it to accumulate the same statistics for both uppercase and lowercase URL
- – s segments: This flag instructs ApacheTop to keep only the first parts of the path, which causes the statistics to be merged for each truncated URL
- – p – protocol: This flag is kept at the front of its referrer strings. By default, it is removed to give more room to more useful information
- – r secs: This flag sets the default refresh delay in seconds
Reading the Output
When we run the apachetop command, at the top of the screen we can see a summary of the statistics, as is shown in the image below.

The first line shows the time of the last hit, ApacheTop running time and the current time of the server.
The second and third lines show the statistics of all the visits since ApacheTop started running. On the second line we can see the total number of requests, along with the number of requests per second; total size of all requests with the number of bytes per second; and the average size of each request. The third line shows the number of requests that are returning 2xx, 3xx, 4xx and 5xx web server response codes.
The fourth and fifth lines show the same statistics as the second and the third respectively, but they only display the information within the specified, or default, time range.
Below these top five lines, we have the list of URLs that are being requested, with the total number of hits for each, and the size of the request in question, as can be seen in the image below.
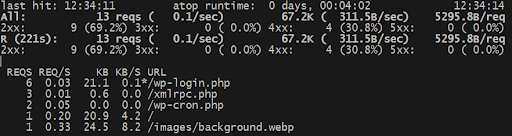
The star (*) symbol next to the URL specifies which request is selected. We can select different requests by moving with the Up and Down arrow keys. Once we reach the request we are interested in, we can press the Right arrow key, which will take us to the page with details for that request. The details include the hosts requesting that URL and the referrers. To return to the main list, we can use the Left arrow key.
We can also switch the main view from showing the URLs, to show Hosts, or Referrers instead, by pressing the d key. In the image below, we are currently seeing the hosts instead of the URLs:

Filters
We can also choose what to see in the view by using filters. We can access those by pressing the f key, and we will be presented with three options:
- add
- clear
- show active
Pressing each of the letters will activate the corresponding action. If we want to add a filter, we would press the a key, and then we can choose if we want to filter by
- url
- referrer
- hosts.
Pressing the corresponding key would let us enter which URL, or referrer or host we want to filter by. Once we enter the information, the view will only show the requests that fit the entered criteria.
Conclusion
The ApacheTop utility is an extremely useful monitoring tool that is easy to use while providing human-readable information that can help pinpoint the cause of certain server and website issues. However, one should keep in mind not to monitor the traffic with an extended time frame or too many hits, as that would use too many CPU and memory resources, which could only add to the problem at hand.