


Featured Freeware: htop
Featured Freeware highlights some of the Liquid Web staff’s favorite free software. This can range from useful command line tools, open-source packages useful in web-development, or even multi-platform applications. This week we are covering a treasured favorite, htop.
Htop, or Hisham’s top, is an interactive process viewer for Unix systems. With htop you are provided the same functionality as top, however it provides some needed improvements. Most are in areas where top shows some of its age; for example, in htop you can scroll the list of processes vertically and horizontally to see all the process info.
Another benefit is that htop seems to start significantly faster, generally when using top there is a bit of a delay while the program loads up some initial data. So now that you know the basics of how htop differs from top, lets get to using it. First you’ll need to ensure it’s installed on the server and if not, we’ll try to get it installed.
Checking for and Installing htop
- First you’ll want to start by logging into your server via SSH:
- Now logged in you can use the `which` command to check if top is installed.
which htop
If htop is not installed the results will look as follows:[root@host ~]# which htop
/usr/bin/which: no htop in (/usr/local/sbin:/usr/local/bin:/usr/sbin:/usr/bin:/opt/cpanel/composer/bin:/root/bin)Note: If htop is currently installed you will not see an error and will be provided the path to the program. - If you see the same, or similar, output to the above then you can continue with the installation of htop. If you are provided the path to htop this means it’s currently installed on your system and you can move past the installation section.
Install htop on your server
The installation process for htop will differ depending on your servers Linux distribution. Below we will provide the command used to install htop on most common Linux distros. To follow the installation directions you will need to be SSH’d into your server as the root user and will need to select the command that matches your OS:
- RHEL/CentOS/Fedora:
To install htop on CentOS style servers you will need to enable the EPEL repository. Since htop is not provided in the default repository you cannot install it before you enable EPEL. For directions on enabling EPEL see our article How to enable EPEL repository? Once you have enabled the EPEL repo you can run:
yum install htop - Debian/Ubuntu:
Simply install htop by running the following command:sudo apt-get install htop - Arch:
While generally used for desktop environments you can install htop on Arch by running:
pacman -S htop
Using htop to Monitor Your System Resources
Now that htop is installed on your server you’ll want to start the program by running the following in a command prompt:
htop
This will open the program and you’ll see something similar to the following:
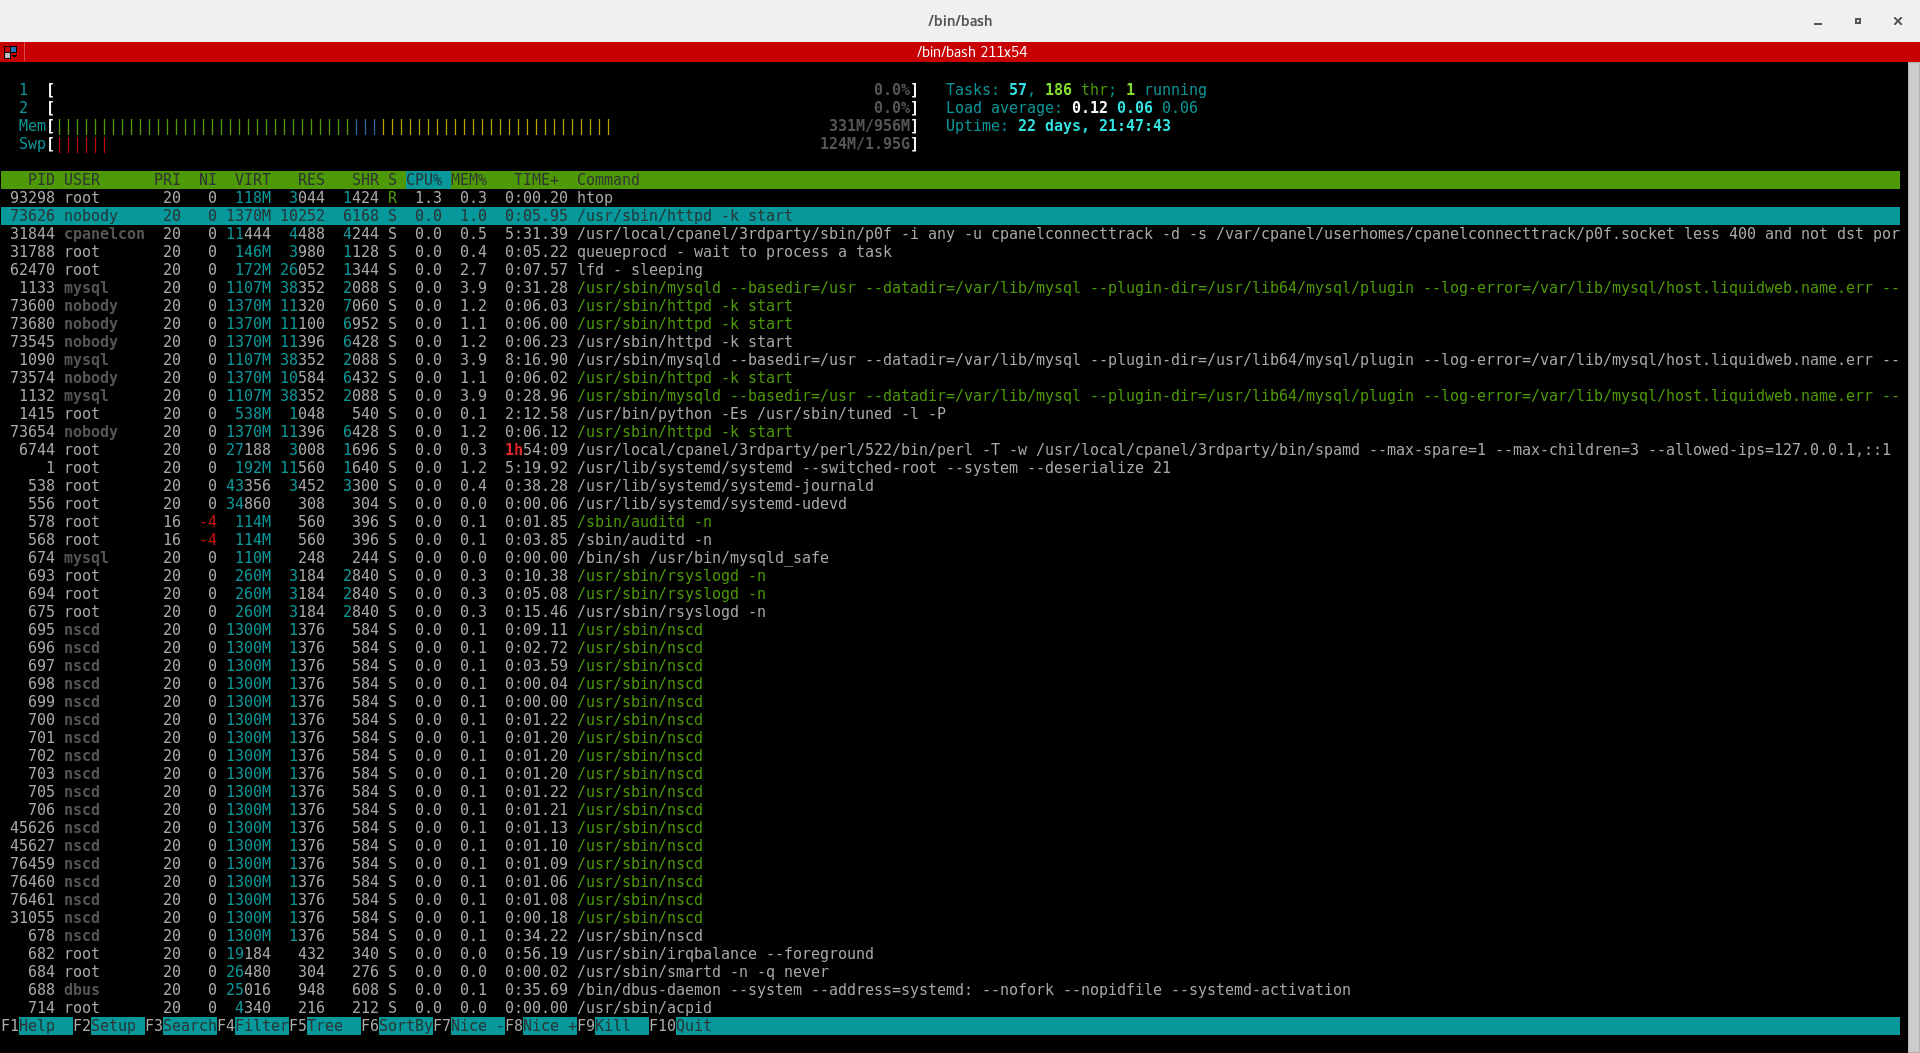
Above you see the overall view of the htop program. Much of it is very similar to top with some added style to improve the over user experience. To best explain the interface below we will break it down by section.
System CPU and Memory Usage:

Above you see the System’s CPU and Memory usage; the numbered rows are for each CPU core’s usage, then those are followed by Mem (RAM) and finally Swp (Swap). Each of the `|` marks are color coded to provide a different meaning. These definitions change a bit between the bar you’re viewing.
For CPU usage the color key is:
- Blue: low priority processes (nice > 0)
- Green: normal (user) processes
- Red: kernel processes
- Yellow: IRQ time
- Magenta: Soft IRQ time
- Grey: IO Wait time
For Memory usage the key is:
- Green: Used memory pages
- Blue: Buffer pages
- Yellow: Cache pages
System Load Averages:
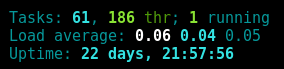 The first thing you see in this section are a number of tasks, these are the processes running on the system currently.
Next is the system load, this is a metric of the total computational work that the system is performing. The load average represents the average system load over a period of time. In order, you see the 1 minute, 5 minute, and 15 minute load averages; bold white, bold teal, and teal, the colors and style may change from system to system.
Wrapping Up
Undoubtedly htop is an awesome tool and a tremendous improvement on the original top tool. There are many for features and uses cases for htop that we will continue to explore in future articles.
For now, you should have the foundation needed to get htop installed on your system. With its easy-to-use interface and improved user controls htop can be a priceless tool for investigating system load issues.
Related Articles:


About the Author: David Singer
I am a g33k, Linux blogger, developer, student, and former Tech Writer for Liquidweb.com. My passion for all things tech drives my hunt for all the coolz. I often need a vacation after I get back from vacation....


Our Sales and Support teams are available 24 hours by phone or e-mail to assist.
Latest Articles
How to use kill commands in Linux
Read ArticleChange cPanel password from WebHost Manager (WHM)
Read ArticleChange cPanel password from WebHost Manager (WHM)
Read ArticleChange cPanel password from WebHost Manager (WHM)
Read ArticleChange the root password in WebHost Manager (WHM)
Read Article