How to Install and Configure Grafana on Ubuntu 20.04
What is Grafana?
Grafana is a data visualization and monitoring tool written in Typescript (frontend) and Go (backend) that allows users to create and edit both log and data graphs and create metrics. Used in conjunction with time series databases such as InfluxDB, Prometheus, Elasticsearch, Grafana can use plugins as templates and ready-made graphs and metrics.
Grafana provides the following opportunities:
- Data Visualization: Allows for fast and flexible visualization with many options and settings.
- Dynamic Dashboards: Provides the ability to create dynamic and reusable panels with templated variables.
- Metrics Exploration: Explore your data with ad-hoc queries and dynamic drill-down by splitting the view and comparing different time ranges and sources.
- Data Logs: Provides tremendous opportunities to use data metrics in a log with labels and filters saved, which can be studied, viewed, and broadcasted.
- Extensive Alert Capabilities: Visually define alert rules for your most important metrics. Grafana will continuously evaluate and send notifications to systems such as Slack, PagerDuty, VictorOps, and OpsGenie.
- Mixed Data Sources: Mix different data sources on the same graph and for each query.
Requirements
- 4 GB RAM server
- 2 kernels
- Ubuntu 20.04
- Root user
Installation on Ubuntu 20.04
Always begin with a system update before installation.
root@host:~#  apt update &&  apt upgrade -y
Hit:1 http://by.archive.ubuntu.com/ubuntu focal InRelease
Hit:2 http://by.archive.ubuntu.com/ubuntu focal-updates InRelease
Hit:3 http://by.archive.ubuntu.com/ubuntu focal-backports InRelease
Hit:4 http://security.ubuntu.com/ubuntu focal-security InRelease
Hit:5 https://download.docker.com/linux/ubuntu focal InRelease
Hit:6 https://packages.cloud.google.com/apt kubernetes-xenial InRelease
Reading package lists... Done
Building dependency tree
Reading state information... Done
All packages are up to date.
Reading package lists... Done
Building dependency tree
Reading state information... Done
Calculating upgrade... Done
The following package was automatically installed and is no longer required:
  libllvm10
Use ' apt autoremove' to remove it.
0 upgraded, 0 newly installed, 0 to remove and 0 not upgraded.
root@host:~#
Install Packages
Install the necessary packages (apt-transport-https and software-properties-common) for the proper Grafana operation.
root@host:~#  apt-get install -y apt-transport-https
Reading package lists... Done
Building dependency tree
Reading state information... Done
apt-transport-https is already the newest version (2.0.5).
The following package was automatically installed and is no longer required:
  libllvm10
Use ' apt autoremove' to remove it.
0 upgraded, 0 newly installed, 0 to remove and 0 not upgraded.
root@host:~#
root@host:~# apt-get install -y software-properties-common wget
Reading package lists... Done
Building dependency tree
Reading state information... Done
wget is already the newest version (1.20.3-1ubuntu1).
wget set to manually installed.
Software-properties-common is already the newest version (0.98.9.4).
The following package was automatically installed and is no longer required:
libllvm10
Use ' apt autoremove' to remove it.
0 upgraded, 0 newly installed, 0 to remove and 0 not upgraded.
root@host:~#Add the GPG key to the trusted keys. This step verifies the download came from the expected source.
root @ host: ~ # wget -q -O - https://packages.grafana.com/gpg.key | apt-key add -
OK
root @ host: ~ #
Add the repository where we will install Grafana.
root @ host: ~ # echo "deb https://packages.grafana.com/oss/deb stable main" | tee -a /etc/apt/sources.list.d/grafana.list
deb https://packages.grafana.com/oss/deb stable main
root @ host: ~ #
Update the packages again.
root@host:~#  apt update
Hit:1 http://by.archive.ubuntu.com/ubuntu focal InRelease
Hit:2 http://by.archive.ubuntu.com/ubuntu focal-updates InRelease
Hit:3 http://by.archive.ubuntu.com/ubuntu focal-backports InRelease
Hit:4 https://download.docker.com/linux/ubuntu focal InRelease
Get:5 http://security.ubuntu.com/ubuntu focal-security InRelease [109 kB]
Get:7 https://packages.grafana.com/oss/deb stable InRelease [12,1 kB]
Get:8 http://security.ubuntu.com/ubuntu focal-security/main amd64 DEP-11 Metadata [24,3 kB]
Get:9 https://packages.grafana.com/oss/deb stable/main amd64 Packages [21,8 kB]
Get:10 http://security.ubuntu.com/ubuntu focal-security/universe amd64 DEP-11 Metadata [58,2 kB]
Hit:6 https://packages.cloud.google.com/apt kubernetes-xenial InRelease
Fetched 226 kB in 1s (212 kB/s)
Reading package lists... Done
Building dependency tree
Reading state information... Done
All packages are up to date.
root@host:~#
Install Grafana
Now we can install Grafana.
root@host:~#  apt install grafana -y
Reading package lists... Done
Building dependency tree
Reading state information... Done
The following package was automatically installed and is no longer required:
  libllvm10
Use ' apt autoremove' to remove it.
The following NEW packages will be installed:
  grafana
0 upgraded, 1 newly installed, 0 to remove and 0 not upgraded.
Need to get 52,3 MB of archives.
After this operation, 178 MB of additional disk space will be used.
Get:1 https://packages.grafana.com/oss/deb stable/main amd64 grafana amd64 7.5.4 [52,3 MB]
Fetched 52,3 MB in 5s (9.819 kB/s)
Selecting previously unselected package grafana.
(Reading database ... 166801 files and directories currently installed.)
Preparing to unpack .../grafana_7.5.4_amd64.deb ...
Unpacking grafana (7.5.4) ...
Setting up grafana (7.5.4) ...
Adding system user `grafana' (UID 126) ...
Adding new user `grafana' (UID 126) with group `grafana' ...
Not creating home directory `/usr/share/grafana'.
### NOT starting on installation, please execute the following statements to configure grafana to
 start automatically using systemd
  /bin/systemctl daemon-reload
  /bin/systemctl enable grafana-server
### You can start grafana-server by executing
  /bin/systemctl start grafana-server
Processing triggers for systemd (245.4-4ubuntu3.6) ...
root@host:~#
Next, enable Grafana to start whenever it boots up.
systemctl enable grafana-serverFirewall Configuration
Now we’ll configure a firewall if one is in use. By default, Grafana runs on port 3000. We need to allow access to this port using the ufw allow ssh and ufw allow 3000/tcp commands.
root@host:~#  ufw allow ssh
Rules updated
Rules updated (v6)
root@host:~#
root@host:~# ufw allow 3000/tcp
Rules updated
Rules updated (v6)
root@host:~#If you need to open a port for a specific subnet, you can use the following example.
ufw allow from 192.168.1.0/24 to any port 3000
Now launch Grafana services with the systemctl command.
root @ host: ~ # systemctl start grafana-server
root @ host: ~ #
Check the Status
Verify whether Grafana is up and running.
root@host:~#  systemctl status grafana-server
● grafana-server.service - Grafana instance
     Loaded: loaded (/lib/systemd/system/grafana-server.service; disabled; vendor preset: enable>
     Active: active (running) since Wed 2021-04-21 20:53:08 +03; 27s ago
       Docs: http://docs.grafana.org
   Main PID: 16895 (grafana-server)
      Tasks: 13 (limit: 9486)
     Memory: 22.8M
     CGroup: /system.slice/grafana-server.service
             └─16895 /usr/sbin/grafana-server --config=/etc/grafana/grafana.ini --pidfile=/var/r>

apr 21 20:53:09 host grafana-server[16895]: {"@level":"debug","@message":"datasource: registerin>
apr 21 20:53:09 host grafana-server[16895]: {"@level":"debug","@message":"datasource: registerin>
apr 21 20:53:09 host grafana-server[16895]: {"@level":"debug","@message":"datasource: registerin>
apr 21 20:53:09 host grafana-server[16895]: {"@level":"debug","@message":"datasource: registerin>
apr 21 20:53:09 host grafana-server[16895]: {"@level":"debug","@message":"datasource: registerin>
apr 21 20:53:09 host grafana-server[16895]: {"@level":"debug","@message":"datasource: registerin>
apr 21 20:53:09 host grafana-server[16895]: {"@level":"debug","@message":"datasource: registerin>
apr 21 20:53:09 host grafana-server[16895]: {"@level":"debug","@message":"datasource: registerin>
apr 21 20:53:09 host grafana-server[16895]: {"@level":"debug","@message":"datasource: registerin>
apr 21 20:53:09 host grafana-server[16895]: t=2021-04-21T20:53:09+0300 lvl=info msg="HTTP Server>
lines 1-20/20 (END)
Launch Grafana
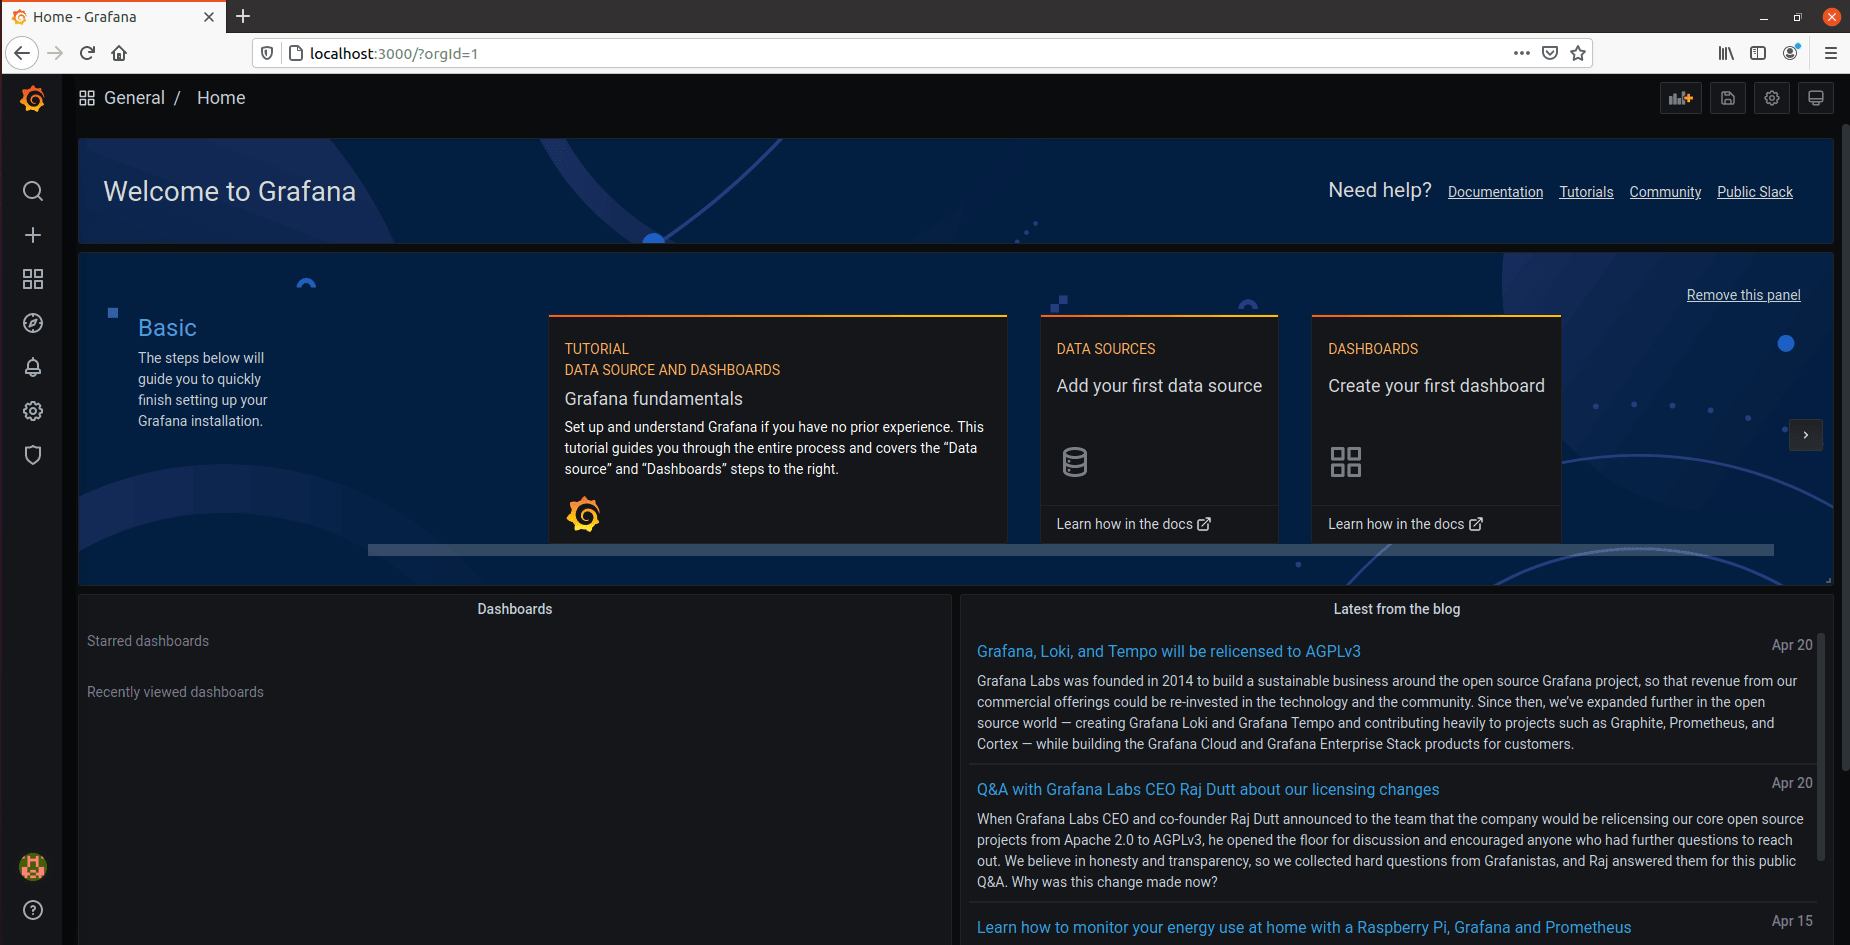
As we can see from the code above, our service is active and Grafana is working. Now we can try to launch the interface. By default, the interface will work at http://localhost:3000/, so input that into your browser address bar.

Input the default username and password, which are both admin. Update your password to a more secure password when prompted.

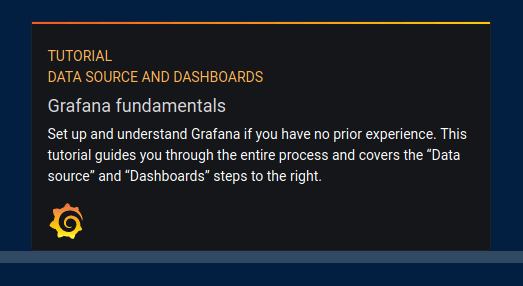
Become acquainted with the Grafana web interface by going through the tutorial.

The tutorial is found under the Welcome to Grafana menu bar.

Disable New User Registration
While not required, disabling registration of new users is recommended. To disable it, you need to go to the configuration file found in the /etc/grafana/grafana.ini path.
Use your preferred text editor to edit the file. In this example, we are using nano.
root @ host: ~ # nano /etc/grafana/grafana.ini
root @ host: ~ #
We find the following lines after opening the file. Change the allow_sign_up = true parameter from true to false.
#################################### Users ###############################
[users]
# disable user signup / registration
;allow_sign_up = true

# Allow non admin users to create organizations
;allow_org_create = true

# Set to true to automatically assign new users to the default organization (id 1)
;auto_assign_org = true
Now, restart the service.
root @ host: ~ # systemctl restart grafana-server
root @ host: ~ #
Check the status to make sure everything was saved and works properly.
root@host:~#  systemctl status grafana-server
● grafana-server.service - Grafana instance
     Loaded: loaded (/lib/systemd/system/grafana-server.service; disabled; vendor preset: enabled)
     Active: active (running) since Wed 2021-04-21 21:15:20 +03; 24s ago
       Docs: http://docs.grafana.org
   Main PID: 17540 (grafana-server)
      Tasks: 12 (limit: 9486)
     Memory: 18.9M
     CGroup: /system.slice/grafana-server.service
             └─17540 /usr/sbin/grafana-server --config=/etc/grafana/grafana.ini --pidfile=/var/run/grafana/grafana-server.pid --packaging=deb cfg:default.paths.logs=/var/log/grafana cfg:default.paths.da>

apr 21 21:15:20 host grafana-server[17540]: {"@level":"debug","@message":"datasource: registering query type handler","@timestamp":"2021-04-21T21:15:20.442153+03:00","queryType":"grafana_api"}
apr 21 21:15:20 host grafana-server[17540]: {"@level":"debug","@message":"datasource: registering query type handler","@timestamp":"2021-04-21T21:15:20.442159+03:00","queryType":"arrow"}
apr 21 21:15:20 host grafana-server[17540]: {"@level":"debug","@message":"datasource: registering query type handler","@timestamp":"2021-04-21T21:15:20.442163+03:00","queryType":"annotations"}
apr 21 21:15:20 host grafana-server[17540]: {"@level":"debug","@message":"datasource: registering query type handler","@timestamp":"2021-04-21T21:15:20.442168+03:00","queryType":"table_static"}
apr 21 21:15:20 host grafana-server[17540]: {"@level":"debug","@message":"datasource: registering query type handler","@timestamp":"2021-04-21T21:15:20.442172+03:00","queryType":"random_walk_with_error"}
apr 21 21:15:20 host grafana-server[17540]: {"@level":"debug","@message":"datasource: registering query type handler","@timestamp":"2021-04-21T21:15:20.442177+03:00","queryType":"server_error_500"}
apr 21 21:15:20 host grafana-server[17540]: {"@level":"debug","@message":"datasource: registering query type handler","@timestamp":"2021-04-21T21:15:20.442181+03:00","queryType":"logs"}
apr 21 21:15:20 host grafana-server[17540]: {"@level":"debug","@message":"datasource: registering query type handler","@timestamp":"2021-04-21T21:15:20.442185+03:00","queryType":"node_graph"}
apr 21 21:15:20 host grafana-server[17540]: {"@level":"debug","@message":"datasource: registering query type fallback handler","@timestamp":"2021-04-21T21:15:20.442191+03:00"}
apr 21 21:15:20 host grafana-server[17540]: t=2021-04-21T21:15:20+0300 lvl=info msg="HTTP Server Listen" logger=http.server address=[::]:3000 protocol=http subUrl= socket=
lines 1-20/20 (END)
You have now successfully restricted users from registering.
Conclusion
Today we learned how to install Grafana on Ubuntu 20.04. Grafana is now one of the most popular graphical monitoring tools and has incredible capabilities like data visualization, dynamic dashboards, and extensive alert capabilities.
Related Articles:

About the Author: Margaret Fitzgerald
Margaret Fitzgerald previously wrote for Liquid Web.
Our Sales and Support teams are available 24 hours by phone or e-mail to assist.
Latest Articles
In-place CentOS 7 upgrades
Read ArticleHow to use kill commands in Linux
Read ArticleChange cPanel password from WebHost Manager (WHM)
Read ArticleChange cPanel password from WebHost Manager (WHM)
Read ArticleChange the root password in WebHost Manager (WHM)
Read Article


