


A Complete Guide to Website Performance
The most important feature of your website isn’t what’s on it: it’s how fast it loads. In other words, your website performance is essential for long-term success.
We like to think of features as the ultimate factor in determining a website’s value. Fair enough, given all the time we put into building them! But, features don’t matter if they go unused. And, if a site takes more than a few seconds to load, it may go unseen.
According to Kissmetrics, 47 percent of consumers expect your site to load in less than 2 seconds.
That’s blazing fast.
The message is clear: If your business is on the web, performance is your business.
What is Website Performance?
Good website performance means a swift and seamless experience for the end user.
Ask a developer, a designer, and a user to define website performance, and you’ll get something different out of each of them.
Ultimately, the only opinion that matters is the user’s: if your metrics scream speed, but your users scream slow, you’ve lost the game.
That’s why the only meaningful definition of website performance has a user-centric approach.
How Important is Website Performance?
When thinking about website performance, the most immediately visible factor for your site is speed. The page speed, also known as the page load time, is the key metric to measure and improve your website efficiency, as it has a great impact on whether the visitor will browse a web page or not.
A website that loads quickly is held in good standing, while a website that loads slowly is not.
However, publishers often fail to recognize exactly how page speed impacts the user experience and, ultimately, how successful the website is in driving its mission forward.
Understanding how site speed and performance impact your website goes deeper than simply establishing that a faster website is better than a slower website.
- How does the user feel?
- What is happening at the server level?
- How is the owner of the site or the publisher affected?
In this section, we will dig into the consequences and ramifications of a slow website and how you can turn site speed into a competitive advantage.
Website Performance and the User Experience
The first way that site performance impacts the user experience comes when site visitors are simply trying to access your content in the first place.
With more and more competition for ever-shrinking attention spans, there is simply no margin for error when it comes to site performance.
As we stated above, research shows that Internet users expect websites to load in less than two seconds.
If your site loads slower than that, traffic declines at an alarming rate.
Imagine for a moment what that means: a human came to your website looking for information or a product to purchase and left before they got what they were looking to purchase.
For all the effort you put into attracting visitors in the first place, this possibility should be downright terrifying. A slow-loading, poor-performing website means that visitors are abandoning the site itself, not because your design or content is unappealing, but rather because your website is too slow.
Furthermore, more than half of all web traffic is coming from mobile devices on slower connections than those available to desktop and laptop computers.
With the stakes so high, site speed and performance have never been more critical.

Website Performance and the Customer Experience
Site performance can also impact visitors that are potential customers. When the experience of shopping online is slow and clunky, it is incumbent on store owners to recognize that customers have a wide range of choices online.
If your eCommerce site is slow, if pages don’t load quickly, or if shopping carts and checkout processes do not move quickly, then customers will leave your website and go somewhere else.”
If you own and operate an online store, you must optimize site performance while visitors browse product pages, choose something to purchase, and try to complete that transaction.
If the purchasing experience is slow and clunky, potential customers will leave and likely never return.
Website Performance and Technology
One of the oft-overlooked aspects of site performance is the effect of performance on search engine rankings.
Slower sites are penalized in search results while faster sites are rewarded.
When you step back and think about it, this practice makes sense. Search engines exist to provide the best possible answer to the user’s search query.
Part of the best answer is the one that presents itself quickly and completely.
In other words, if every time you clicked a search result from Google or Bing and the resulting page took five to ten seconds to load, you would be disappointed and maybe even aggravated. Over time, you might even choose to use a different search engine to locate information entirely.
Speed is a critical part of succeeding with search engines. Neglecting website performance while trying to achieve higher search engine rankings is a fool’s errand.

Website Performance and Your Brand
The impact of site speed and performance listed above are reason enough to pay attention to how quickly your web pages are loading and how quickly your shopping cart is operating. But even if that were not the case, you should understand and appreciate the impact of website performance on the perception of your brand.
Whether operating a business website or a site for your personal hobby or interests, you want to put your best foot forward by offering visitors a website that is fast in loading all elements, images, and content.
Think about your brand in this way:
Imagine you choose to visit a car dealership with an interest in buying a car. And suppose the salesperson you are speaking to says, “Thank you for stopping by. Why don't you take this SUV for a test drive? It's our fastest one!” You expect the SUV to be great, but it took a full 30 seconds to reach 55 mph on the highway. The SUV is slow and not worth buying.
That’s the impression visitors are left with when your website is slow and performs poorly.
Website performance is a reflection of your brand, and a slow website that frustrates users will give them a negative perception of you.
So, now that you understand the impact of your website’s speed, how can you begin testing your website performance today?
How to Test Website Performance
It’s time to test your site to see where the improvements are needed most to minimize bounce and maximize conversion, including:
- Website performance terminology.
- How to read waterfall charts.
- How to make the most of the statistics they contain.
Waterfall Charts
The most important tool in improving website performance is the waterfall chart. It shows exactly how long users have to wait for each component of your client’s site to load. The waterfall tool will become your go-to tool for benchmarking speed before and after making website performance improvements.
Source: WebPageTest
WebPageTest is a free, configurable tool that can generate waterfall charts for any site you’re working on. For those using GTmetrix, which is another popular tool for monitoring site performance, Liquid Web has created a guide for GTmetrix reporting.
How Your Web Browser Finds Sites
To understand waterfall charts, we need to know a bit about how browsers find sites on the web.
At its heart, every website is just a collection of files hosted on a computer somewhere. Finding any site is a three-step process consisting of:
- DNS lookup.
- Handshaking to establish a TCP connection.
- Content download.
When you visit a website, the browser uses its Uniform Resource Locator (URL) to find the computer hosting the site. This process is called a Domain Name System (DNS) lookup.
Once the browser finds the host computer, it requests permission to connect and asks for whatever resources it needs to display the site — primarily JavaScript, HTML, CSS, and image assets.
If all goes well, the server accepts the connection and sends the resources back. This process, called handshaking, opens up a Transmission Control Protocol (TCP) connection, which is a communication channel that the browser uses to download the site’s resources from the server.
Next, let’s look more closely at the waterfall to determine what is most important to user perception of your site speed.
Reading Waterfalls
Waterfall charts tell us how long a site’s users have to wait for each of these steps to complete. You don’t need to have the entire site load within two seconds, although that would be best. But what matters most is that the user perceives it has loaded, which we will get into below.
There are two types of information to digest when reading waterfall charts:
- High-Level Metrics: Measurements of events that directly affect a user’s ability to use a website and their perception of how fast it loads.
- Low-Level Metrics: Millisecond-precision measurements of how long it takes the browser to load each individual resource.
High-Level Metrics
The most important high-level metrics are:
- Start Render: How long a user has to wait before the browser starts displaying content.
- DOM Interactive: Time until the website responds to button clicks, scrolling, and other interactions.
- Document Complete: Time until the browser has loaded all page resources, including those that the user can’t see or interact with.
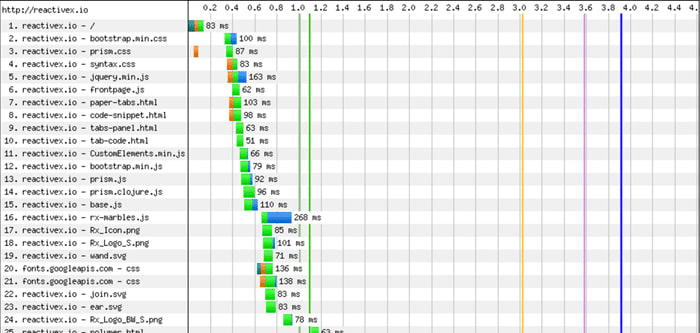
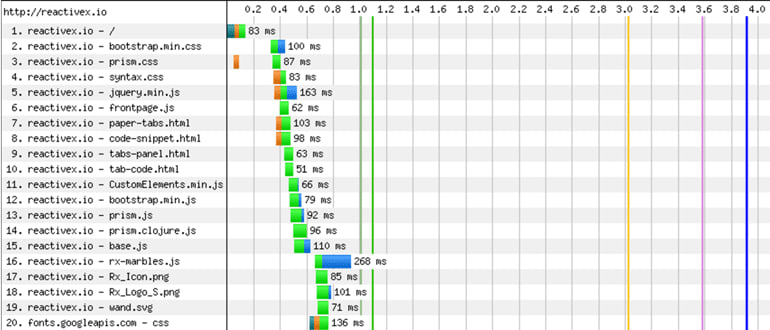
Let’s take another look at that waterfall chart from earlier.
The bright green line near 1 second is time to Start Render. The yellow line, at 3 seconds, is time to DOM Interactive. Finally, the dark blue line, just before 4 seconds, is time to Document Complete.
This is what the page looks like at start render:

What the user sees 1.1 seconds after visiting the site.
While the above image shows that the site has only loaded the top banner, this indicates to the user that the site is indeed loading, and most users will stick around for another few seconds to start interacting with the site. It may be boring to look at, but even this is enough to satisfy user impatience.
Each of these three metrics has a different relationship to user experience.
- Start render is tied to how long users feel it takes a site to load. A quick start-render satisfies users’ expectations that a site loads in 2 seconds or less.
- DOM interactive is arguably the most important metric. If a user can interact with what they’re looking for before the page loads completely, it will feel complete to them.
- Document Complete is the point at which the browser has rendered all static assets, including scripts a user might not even know about. This is when it’s safe to assume the user sees the site as intended.
Ideally, you’ll want these events to occur as early as possible.
Another high-level metric you can use is Largest Contentful Paint (LCP), which some find more useful to measure perceived load speed since it records the render time of the largest image or text block visible above the fold.
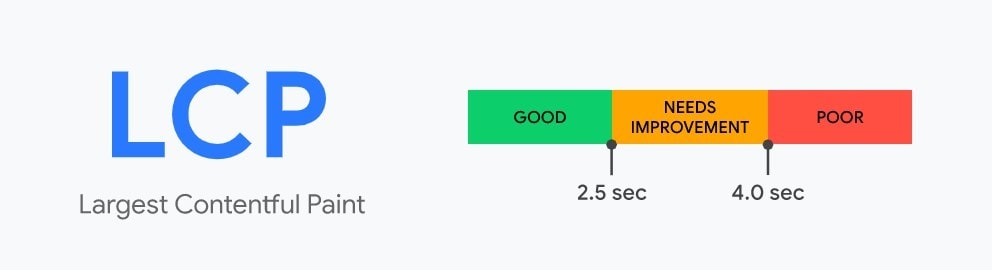
Source: web.dev
The best plan of attack is to generate a waterfall chart for your client’s site as a benchmark and make improvements from there.
Don’t forget to check the render videos and screenshots after making changes. After all, what your client’s users see, and how quickly they see it, is what we’re trying to optimize!
Low-Level Metrics
On the left of the waterfall chart is an ordered list of files that the browser had to download to display the page. Each of these represents an HTTP request — something the browser had to ask for and the server had to send back.
Just to the right of each file is a multi-colored bar. The longer the bar, the longer it takes the browser to download the associated file. Where each bar begins relative to the others indicates whether it is fetched before or after other resources on the list. The fact that some come after others gives the chart its characteristic waterfall shape.
Each color represents a different step of the browser-server communication pipeline:
- Dark Green: Indicates a DNS lookup. A browser has to do a DNS lookup for each different domain it connects to.
- Orange: Represents time spent handshaking. Not every resource should have an orange bar.
- Bright Green: Represents Time To First Byte (TTFB), or the time before the server starts to respond to the browser’s request for a resource.
- Bright Blue: How long it takes the browser to download the file once the server sends it back.

From left:DNS Lookup, TCP Connection, TTFB, & Content Downloads
In general, you want as few bars as possible, and you want them to be as small as possible.
Now that you have tested your site's performance, it's time to increase your website speed.
Find out exactly how to improve site speed with our ten-step checklist below.
10 Ways to Increase Your Website Performance
Here are the ten best tips for improving your website performance and speed so as to have the best chance to get the most traffic and keep customers shopping.
1. Compress Images
Needless to say, if your website contains large pictures, then your site’s loading time can take minutes instead of seconds. To boost this process, we recommend you compress the images before using them on any webpage. Try free online image compression software, such as OptimiZilla or TinyPNG, to easily and quickly compress images before uploading to your site. Software such as Adobe Photoshop can also help with compression.
2. Minify Styles and HTML
Optimize your website code to decrease load times. It is a good idea to remove any unnecessary formatting, comment field(s), or unneeded webpage code, thus improving the efficiency of your site. Also, look for ways to keep your content concise while covering the topic’s breadth and depth as needed, something that services such as Essay Tigers can help with.
3. Reduce HTTP Requests
For the best site performance, shorten the way of the visitors' request as much as possible. For instance, avoid multiple redirects when a person clicks on your website using a smartphone.
- Don't: www.website.com -> m.website.com -> m.website.com/home.
- Do: www.website.com -> m.website.com/home.
Every redirect can cost you the loss of a potential visitor with longer load times.
4. Limit Heartbeat API
The Heartbeat API is a WordPress feature that boosts the communication between your browser and the server while you are using the backend Admin Panel.
While this feature can be highly useful for things such as viewing previous post-editing versions or site notifications in real-time, it can also cause high numbers of requests, which can over-utilize your CPU past certain limits, causing your site to slow down.
It’s best to limit the Heartbeat API rather than turning it off completely.
5. Use Static Cache
With a static cache policy, after your visitors revisit your website for a second time, there is no need to send another HTTP request to the server, as the information from the previous visit has been stored in the visitor’s cache (temporary storage).
It is a good idea to apply a 20-minute cache policy to websites like blogs or forums.
6. Apply a CDN
Using content delivery networks (CDNs) can be a wonderful solution to website performance optimization.
A CDN is responsible for delivering static content quickly, which can play a critical role in your website performance. Content delivery networks such as Akamai or Cloudflare work by storing static content from your site at nodes across the globe. As a result, audiences who access your site that are geographically close to the CDN nodes will get content more quickly.
For example, let’s say your origin server is in the USA. You could use the CDN servers to host files globally and increase performance for audiences overseas.
7. Use CSS Font-Display
A great option to boost page speed is to apply the CSS font-display, which is in charge of how to download and display font files in the browser. With this code, you can show the website content before it's done downloading. That is why the visitor will get the information at once, and after measuring the network speed, the browser gradually uploads the custom font. If the speed is too low and requires a lot of time to download the custom font, it won't be downloaded, reducing the load time.
8. Choose the Right Web Hosting
Most website owners opt for the cheapest hosting option at the beginning, such as shared hosting. However, if the website starts gaining traffic, you might consider switching to another hosting type to increase performance and ensure a successful user experience.
Virtual Private Servers (VPS) or Dedicated Servers can both provide more scalability and performance for sites that are growing quickly or having high volumes of traffic. For true elasticity and burstable bandwidth for cPanel sites, you can move to Cloud Servers.
9. Optimize the Database in Your Content Management System (CMS)
The right database optimization can help you to significantly increase your website’s performance. If your CMS system is packed with multiple complex plugins, the size of the database increases and negatively influences the speed of your website.
Take note that content management systems store comments, blog posts, images, and other information that fills up data storage. Database optimization measures will vary depending on the CMS you use. If you use WordPress, you might consider utilizing the benefits of plugins such as WP-Optimize for database optimization.
Those who rely on Windows-based CMS systems can rely on support from the platform directly as well as support for the hosting infrastructure.
10. Use Prefetching Techniques
Prefetching is about anticipating user behavior and executing instructions before a user initiates them. Although most modern browsers allow for prefetching by default, SEO specialists can better analyze the potential user behavior and make hints for browsers to do prefetching work. There are three main types of prefetching: DNS-prefetching, link prefetching, and prerendering.
- DNS-prefetching means resolving domains into IP addresses in advance.
- Link prefetching ensures a stable user journey. If you know that a user will click on a particular link to move to a specific page, this type of prefetching should be applied.
- Prerendering allows rendering an entire page in advance for better performance.
An Entire World Dependent on Performance
When you take all of the factors listed above into account, it should be clear that site speed and performance are crucial to your website’s success. Whether you are simply sharing your personal thoughts on a blog or promoting your business and selling goods online, site performance has never been more important.
Savvy site owners and publishers are vigilant in looking for ways to improve site performance. Be one of them with Liquid Web as a partner powering your site’s performance now and into the future.


Ronald Caldwell
Ron is a Technical Writer at Liquid Web working with the Marketing team. He has 9+ years of experience in Technology. He obtained an Associate of Science in Computer Science from Prairie State College in 2015. He is happily married to his high school sweetheart and lives in Michigan with her and their children.


Keep up to date with the latest Hosting news.