
 Jan Koch
 One of the go-to tools for analyzing a website’s loading speed is called GTmetrix.
They are one of the most-used service providers for loading speed analysis reports, alongside Pingdom and Google PageSpeed Insights.
Since I do loading speed optimization for a living, I want to take some time and explain how to understand the GTmetrix reports. I run around 200 websites through GTmetrix on a day-to-day basis, so I hope you can learn something here.
This post focuses on the first two scores in GTMetrix, the “PageSpeed” and “YSlow” scores. There is also information about a “Waterfall” model and the timings of your website, which we’ll just briefly touch on. If you implement the recommendations from the first two scores, you’ll be optimizing your site pretty good already.
The last two tabs will show additional information about specific parts of your site taking long to load. I’ll briefly walk you through understanding those tabs as well. We’ll be using a WordPress website as an example.
GTmetrix Reports: What Numbers are Important?
Before we dive deep into the details of a report, let’s talk about numbers and metrics you should not focus on.
To address the elephant in the room, don’t pay too much attention to your PageSpeed Score. Most often, it’s not feasible and a waste of money and time to get your PageSpeed Score to 100/100. The recommendations are tailored towards medium-sized companies who have their own employees handling their IT. And sometimes the suggestions are plain impossible, e.g. minifying scripts that aren’t hosted on your server (like the Google Analytics Javascript)
So just like school grades are not an indicator of intelligence, Google’s PageSpeed grade is not actually an indicator of speed. – Lucy Beer (WP Rocket)
So, please don’t get obsessed with those big numbers showing up on GTmetrix. It’s possible that you’ll end up with a score anywhere around 60 or 70 but a loading time under 1.5s – which is blazingly fast.
Focus on the user experience and the actual loading time, rather than trying to get your scores to 100.
First, the GTmetrix Pagespeed Tab
The Pagespeed tab is the first step in analyzing your report. It shows the most basic information and the lowest hanging fruit for making your site load faster. Depending on your theme, the images you uploaded, the plugins you’re using, and many other settings, the Pagespeed tab will show different information for every site.
Here is a screenshot of what the results in the Pagespeed tab can look like:
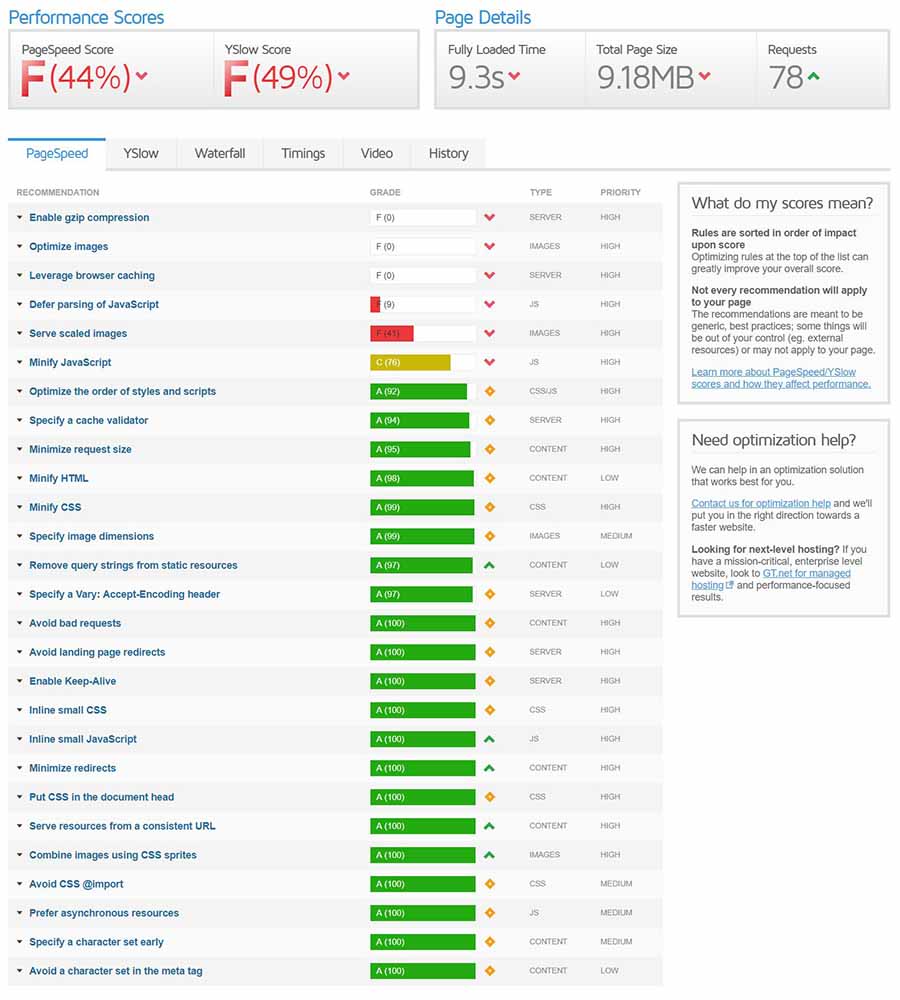
As you can see, there’s quite a bit to talk about regarding GTMetrix. The report has shown plenty of potential for improvement.
Compressing Files with Gzip
The first recommendation is to enable gzip compression. Without getting too technical, gzip is a webserver module that compresses the file size of your website and thus reduces the amount of data your visitor needs to download when accessing your site. We have a guide on configuring W3 Total Cache on our blog that includes enabling gzip compression.
Note that in some instances you cannot follow that recommendation completely. When expanding the block for gzip compression, GTmetrix presents you with a list of scripts to compress. Sometimes, it’ll show scripts you cannot control – like scripts from Google Analytics, Google Tag Manager, Facebook Pixel scripts, A/B testing tools, etc. You can recognize those by the URL is different from your page’s URL.

This example from a different page shows a ManyChat script that should be compressed with gzip. However, since that script is located on the ManyChat servers, they are the only ones that could compress it. Furthermore, the website owner would save only 1.2KiB in file size by compressing the file. There’s no reason to assume that this improvement would make a noticeable difference in loading speed – it’s too marginal. In these situations, I recommend you accept the “A(99)” rating for this subcategory as good enough.
Optimizing Your Images For Loading Fast
On most websites, you’ll also see the Optimize Images message showing up. That message relates to image files being bigger than they need to be. Often, images can be compressed in file size without losing quality or getting blurry.
Liquid Web’s Managed WordPress Hosting plans already has image compression integrated, so you can safely skip towards the section about serving scaled images.
Many WordPress plugins can make reducing image file sizes a breeze. A popular free plugin is EWWW Image Optimizer, which you can install directly from the WordPress plugin repository. I have also seen good results with the paid version of the Swift Performance plugin. It compressed over 4k images on WP Mastery and saved me 37% of file size in total.

You can see that images can have a significant impact on loading time, as GTmetrix even comes with a second recommendation tab for them. Serving Scaled Images is also dedicated to optimizing them for loading speed, but targeting a different challenge in using images.
Many website owners merely upload images in the wrong dimensions, going too big with their image sizes. This time we’re not talking about the KB or MB of file size, but about the pixel dimensions.
Let me give you an example of what you can do to follow this recommendation. Below is a screenshot from a real-world example. I have hidden the domain and filenames for privacy reasons. Still, you can see that in this particular case the website owner can save 410KiB (that’s 87% of the entire image file size) by just scaling down his images.
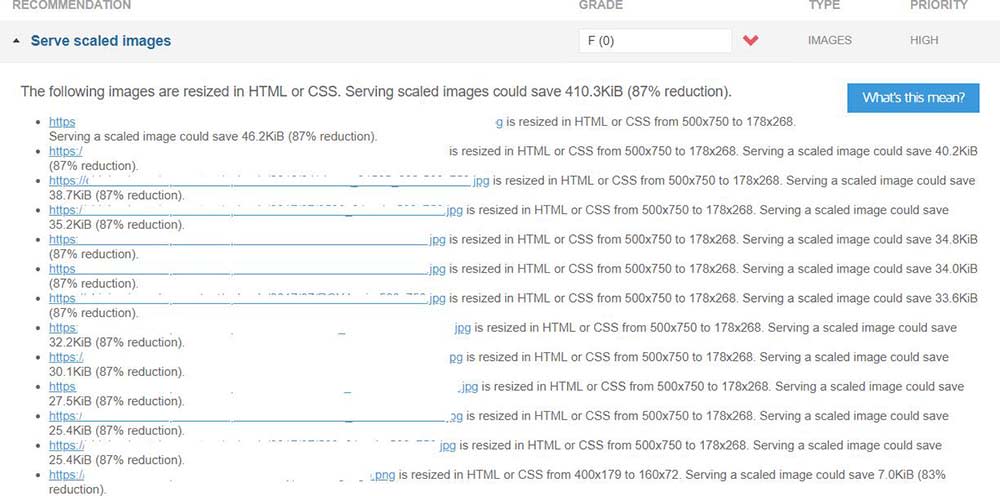
If you see the Serving Scaled Images recommendation for your site, GTmetrix will show you which images are being uploaded with too big dimensions. In the screenshot, you can see that many images have been uploaded in 500px width and 750px height, which get then resized through CSS code to 178px by 268px.
This point is especially critical if your theme does not automatically configure the “srcset” attribute in the theme code. That attribute tells your browser to load different variations of the image based on the width of the browser. It allows showing bigger version for bigger screens to avoid making small images look blurry while loading smaller image versions on small devices to prevent loading unnecessarily big files.
You can easily find out if your theme uses the srcset attribute by using the Chrome Inspect Tools. Right-click on the image and then search through the code until you see the “srcset” command. It should look somewhat similar to this screenshot:

Optimizing Caching and Setting Expiration Headers
I’d like to group the next three recommendations into one section in this article, as they usually are achieved with the same type of WordPress plugin: a caching plugin. One of my preferred free caching plugins is Swift Performance Lite. It gives plenty of options to tackle the next recommendations from GTmetrix.
Let’s first discuss the Leverage Browser Caching entry in the GTmetrix report above. Browser caching tells your browser not to download files again if they have already been downloaded in a specific time-frame before.
These are the settings I use on my own site, feel free to copy them or use them as a starting point.

Let me walk you through the most critical settings here:
Enable caching makes Swift perform the caching and enables the entire section. The caching mode will depend on your web hosting setup. You might see other options than “Memcached with PHP,” e.g. “Disk cache with rewrites” or “Disk cache with PHP.” I recommend you test what works best for your site.
The Cache Expiry Mode prevents your cache from getting too big. I usually use the “Action Based Mode,” which rebuilds the cache every time I publish or edit content on my website.
Enable Browser Cache, Send 304 Header and Cache 404 Pages are activated to tell your visitor’s browser that you have caching in place. We talked about Enable gzip already in a section above.
There are many other good caching plugins. You’ve likely heard about W3 Total Cache, WP Super Cache, WP Fastest Cache, and alike. In the end, they all perform similar tasks on your website, and it boils down to what works best for you. You might want to test two or three of those plugins and use the GTmetrix reports for comparison.
With those plugins, you can (and should) also configure expiration headers. Those tell a browser for how long it’s safe to use local copies of your website’s files instead of downloading them over and over again.
To quote GTmetrix:
“Expires headers tell the browser whether they should request a specific file from the server or whether they should grab it from the browser’s cache. The whole idea behind Expires Headers is not only to reduce the load of downloads from the server (constantly downloading the same file when it’s unmodified is wasting precious load time) but rather to reduce the number of HTTP requests for the server.”
If the message still comes up after you enabled the Expires headers in your caching plugin, you can try adding this to the top of your .htaccess file via FTP:
<IfModule mod_expires.c>
ExpiresActive on
ExpiresByType text/css “access plus 30 days”
ExpiresByType text/javascript “access plus 30 days”
ExpiresByType image/ico “access plus 30 days”
ExpiresByType image/jpg “access plus 30 days”
ExpiresByType image/jpeg “access plus 30 days”
ExpiresByType image/gif “access plus 30 days”
ExpiresByType image/png “access plus 30 days”
ExpiresByType text/css “access plus 30 days”
ExpiresByType text/html “access plus 30 days”
</IfModule>
Disclaimer: Editing your .htaccess file can break your site. Be careful only to copy the code above and copy your .htaccess file before doing this, so that you can replace your edited version with the original file in case things go wrong.
Understanding the YSlow Score Tab
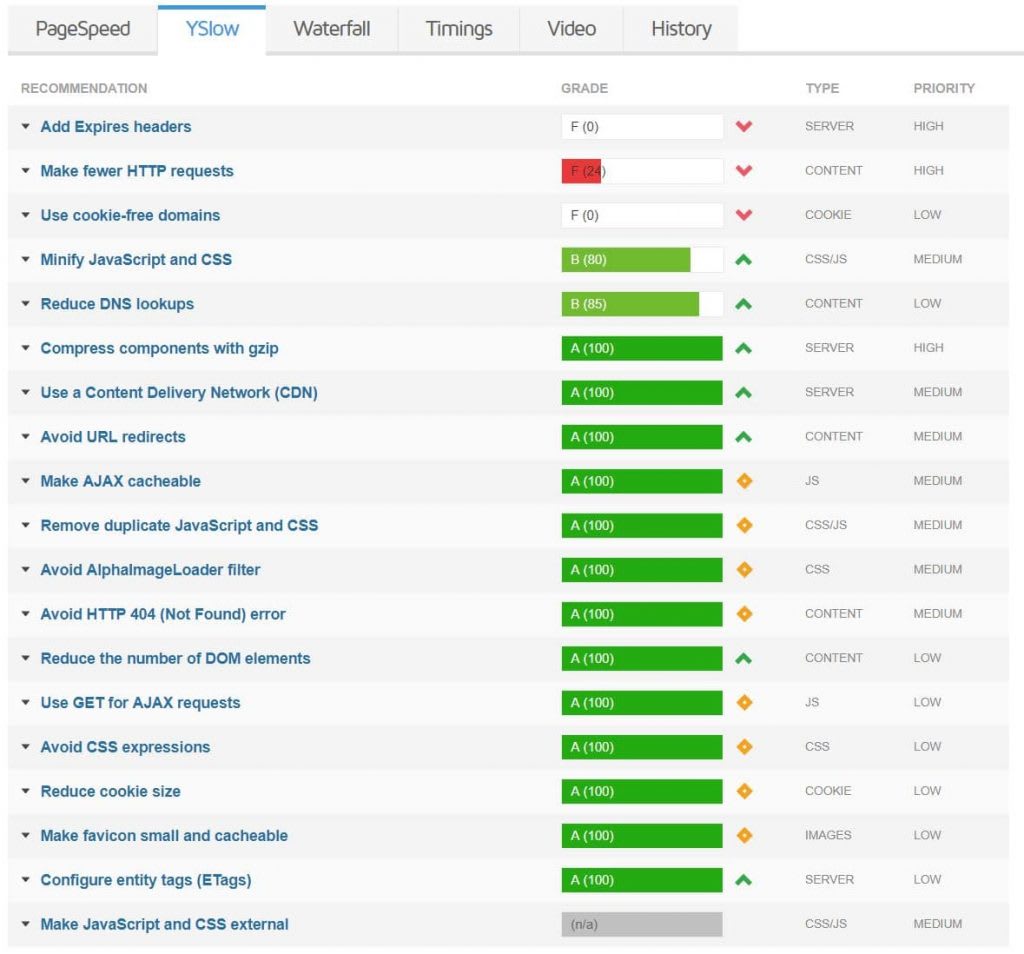
The next tab in the GTmetrix report is called “Yslow Score.” It’s based on an algorithm created by Yahoo! to measure the performance of a website and can give complementary insights to the PageSpeed tab.
Here’s an example chart:
Make Fewer HTTP Requests
Since we already talked about adding Expires headers, let’s continue with another recommendation you’ll almost certainly see coming up: Make fewer HTTP requests.
According to Yahoo!’s guidelines, “80% of the end-user response time is spent on the front-end. Most of this time is tied up in downloading all the components in the page: images, stylesheets, scripts, Flash, etc. Reducing the number of components, in turn, reduces the number of HTTP requests required to render the page. This is the key to faster pages.”
When you expand the “Make fewer HTTP requests” section, you’ll see a message like this:

So your starting point would be to figure out what scripts and stylesheets are being loaded and whether it’s possible that you combine them into fewer files. I find this to be somewhat difficult or even impossible at times, as those scripts are like from Google Analytics, your Facebook Pixel, Google Adwords tracking, etc. – which you have no control over. So you might need to accept an imperfect score here.
To reduce the number of HTTP requests, you can also combine small graphics into CSS sprites (e.g. using a Sprite Generator), create image maps, or use inline images with the data: URI scheme. These three methods usually require quite a bit of work though, and it’s up to you whether you can perform them yourself or if you need to hire a developer. Those image optimization methods usually take up more time and money to complete, so you need to decide whether they’re ROI-positive or not.
Use Cookie-Free Domains
Setting up a cookie-free domain can be a significant boost in performance, as this allows you to ensure cookies aren’t sent with your static files (which usually don’t need to be cookied). Following this recommendation, you avoid unnecessary network traffic by not sending over cookies you don’t need.
To set up a cookie-free domain, you’ll need to set up a dedicated domain for your static content and point it to your wp-content directory. That domain could be static.yourwebsite.com. By setting the following constants in your wp-config.php file, you can tell WordPress to use that URL as wp-content URL and to set cookies for your root URL:
define(“WP_CONTENT_URL”, “http://static.yourwebsite.com”);
define(“COOKIE_DOMAIN”, “www.yourwebsite.com”);
Some people recommend you should even go as far as getting your own domain for the static contents. They use examples of Yahoo! using yimg.com and YouTube using ytimg.com as reasoning.
Hint for Cloudflare users: you won’t be able to set this up. Cloudflare adds a cookie to measure their security rules against your website traffic, so you’ll need a different CDN than Cloudflare. That being said, Cloudflare caches static content by default, and you can verify that your content is being cached through Chrome’s browser tools (see screenshot below).

In the Network tab, you can analyze the static content like JavaScript files, stylesheets or images. If the response headers include cache-related headers as shown in the screenshot, your static content is getting cached by Cloudflare.
Setting up a cookie-free domain is then a decision on whether it’s worth it to you or whether your current configuration with Cloudflare is good enough.
Use a Content Delivery Network (CDN)
Lastly, for the Yslow tab, I’d like to emphasize the importance of using CDNs. If your website visitors are located not just in a single location but all over the world, these make sense to implement.
Liquid Web’s fully-managed customers can add Cloudflare CDN hosting to their website at no additional cost. Customers can also upgrade to our Cloudflare paid packages to get even more features.
If you’re not on Liquid Web, you can create a free Cloudflare account and set up a CDN through their service. You can integrate them with your current caching plugin or install their own plugin from the WP Plugin Repository.
What’s in the GTMetrix Waterfall Tab?
In this tab, you’ll see every single file that your site is loading. GTmetrix will show you all the details about how each file is impacting the loading time. By hovering your mouse over that file’s bar, you’ll get the data on the specific states of the file transfer from your server to the browser of your visitor.
There are two states you should focus on in your loading speed optimization efforts: blocking (tan) and waiting (purple).

This is an example report of a website we analyzed during our prospecting phase. As you can see, it isn’t configured ideally.
The first three requests alone take 5.49s to complete, most of that is waiting time (purple). The requests following an increase in render-blocking time (tan), slowing down the website.
In a situation like this, you want to set up asynchronous loading of static resources like images, JS and CSS. That’ll remove the render-blocking times seen in the bottom rows and will reduce the tan color to a minimum.
You’ll also want to reduce the waiting times from the first three rows as much as possible. Those can be caused by various things though. Often, you’ll see good results with changing to a speed-optimized web host like Liquid Web, optimize your website’s database with a plugin like WP Sweep, and talk to your hosting support if they have further recommendations.
Navigating the Timing Tab
The timings tab provides additional insights into the loading time and the related user experience.

The first “Redirect” block shows how much time it takes for the visitor’s browser actually to get redirected to your web server. A typical example is that your visitors enter http://yourwebsite.com and then your domain provider has to redirect them to the HTTPS encrypted version of your website at https://yourwebsite.com.
As you can see, in this example (not made up!), that process takes 3.6s – which is already longer than the entire loading time of the website should be. My recommendation here is to change domain name registrars and double-check the SSL implementation with your web host.
The connection process itself is ok, taking up only 223ms. But after that, we see another slow process.
The web host takes 1.5s to gather the data for the website for sending it back to the browser of your visitor. Usually, that is related to slow web hosting or overloaded server resources – and to a messy database structure in the backend of WordPress.
I already mentioned the WP Sweep plugin, which can help clean up your database (make a backup before running it!).
If that doesn’t help, you’ll want to talk to your hosting company about either upgrading your package or moving to a different company if they cannot fix the slow response times.
The timings tab also shows that it takes more than 5 seconds for the visitor’s browser to receive the first byte of data from your website. I think we’d agree that people will get quite frustrated if they have to stare at a white screen for 5 seconds after entering your website’s URL.
With that, I’ll consider this basic walkthrough for GTmetrix reports done. There are many more recommendations to talk about and many more questions to be answered. But with the starting points given in this article, you’re set to optimize your website to a solid level already. If you want to take it further, you’ll now know what information to look out for.