◦ Low-latency network
◦ Secure and compliant
The server dashboard effect: How monitoring became a mindset
For many IT professionals, checking server or portal dashboard has become a daily, and sometimes even hourly, habit.
To understand the role these tools play in system monitoring and incident response, Liquid Web surveyed over 600 IT pros from a range of industries and hosting providers. Respondents included systems administrators, backend developers, and DevOps engineers, in addition to other roles.
The findings reveal how dashboard design, alert fatigue, and even past outages influence behavior, loyalty, and expectations for AI-powered improvements.
Key findings
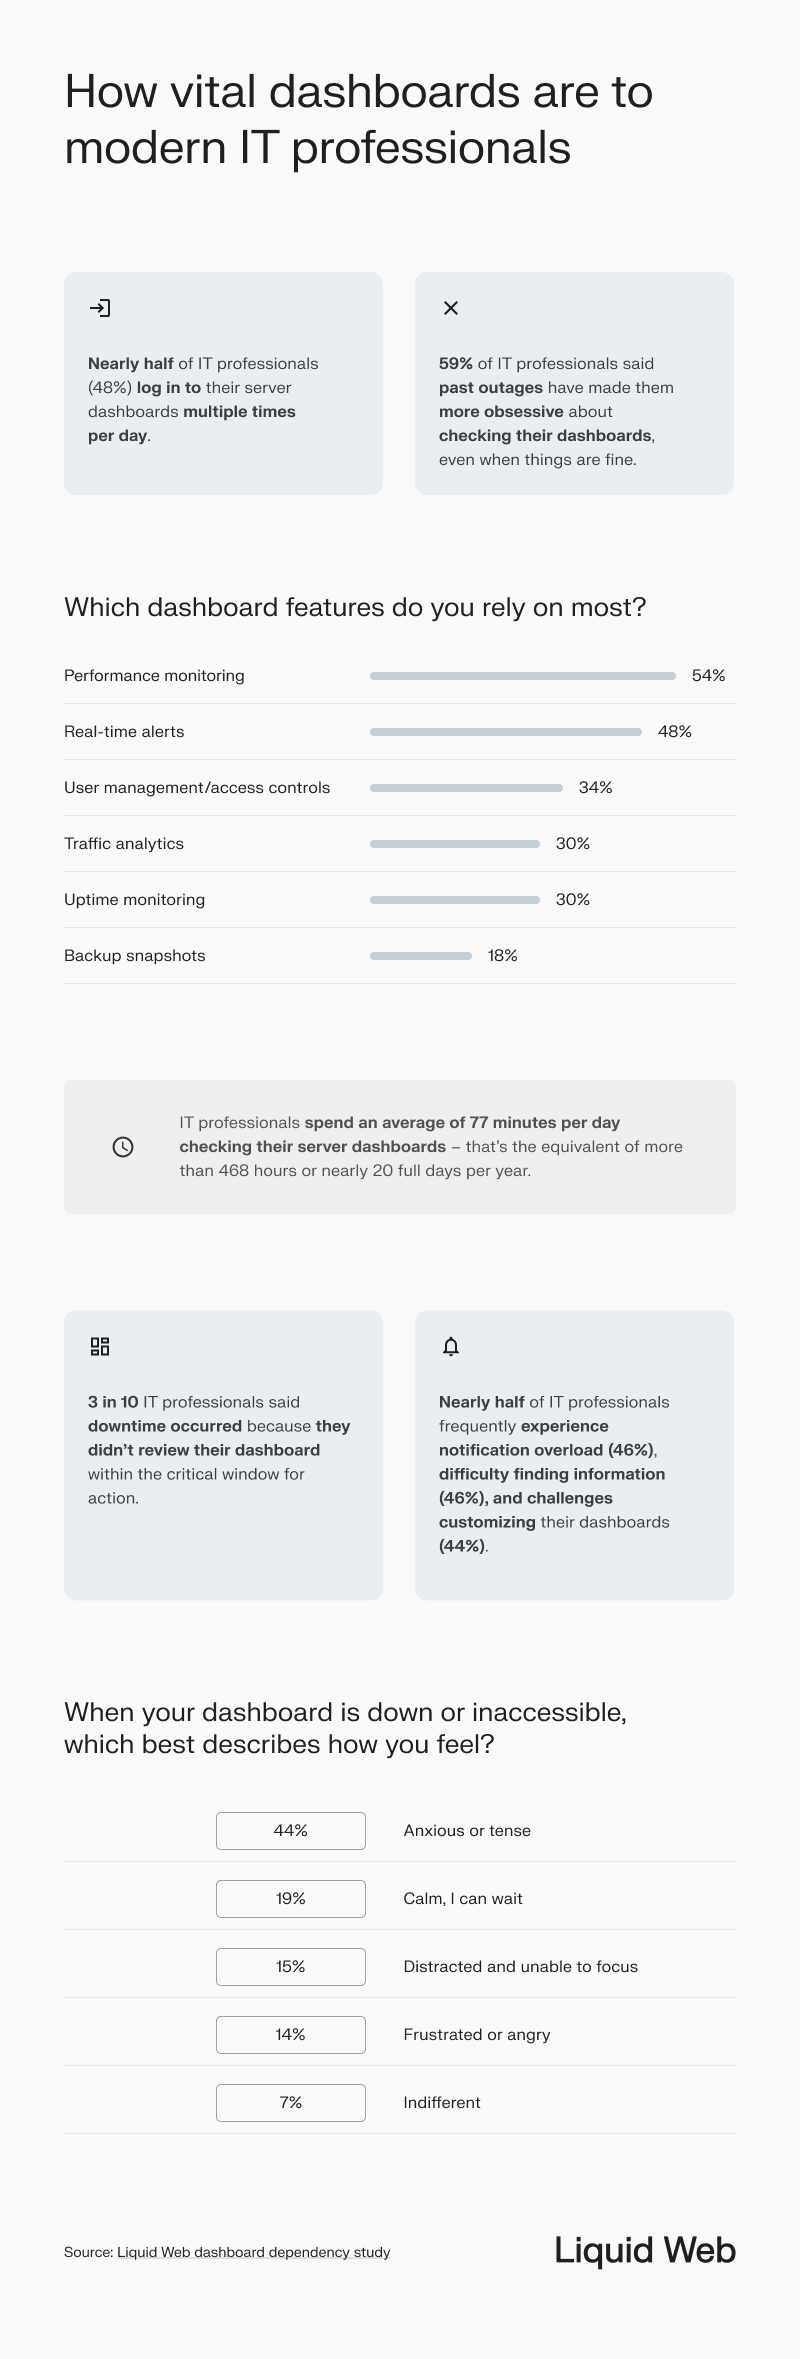
- 59% of IT professionals said past outages have made them more obsessive about checking their dashboards, even when things are fine.
- On average, IT professionals spend “77 minutes” per day checking their server dashboards. That’s equivalent to more than 468 hours or about 20 full days per year.
- 3 in 10 IT professionals said downtime occurred because they didn’t review their dashboard within the critical window for action.
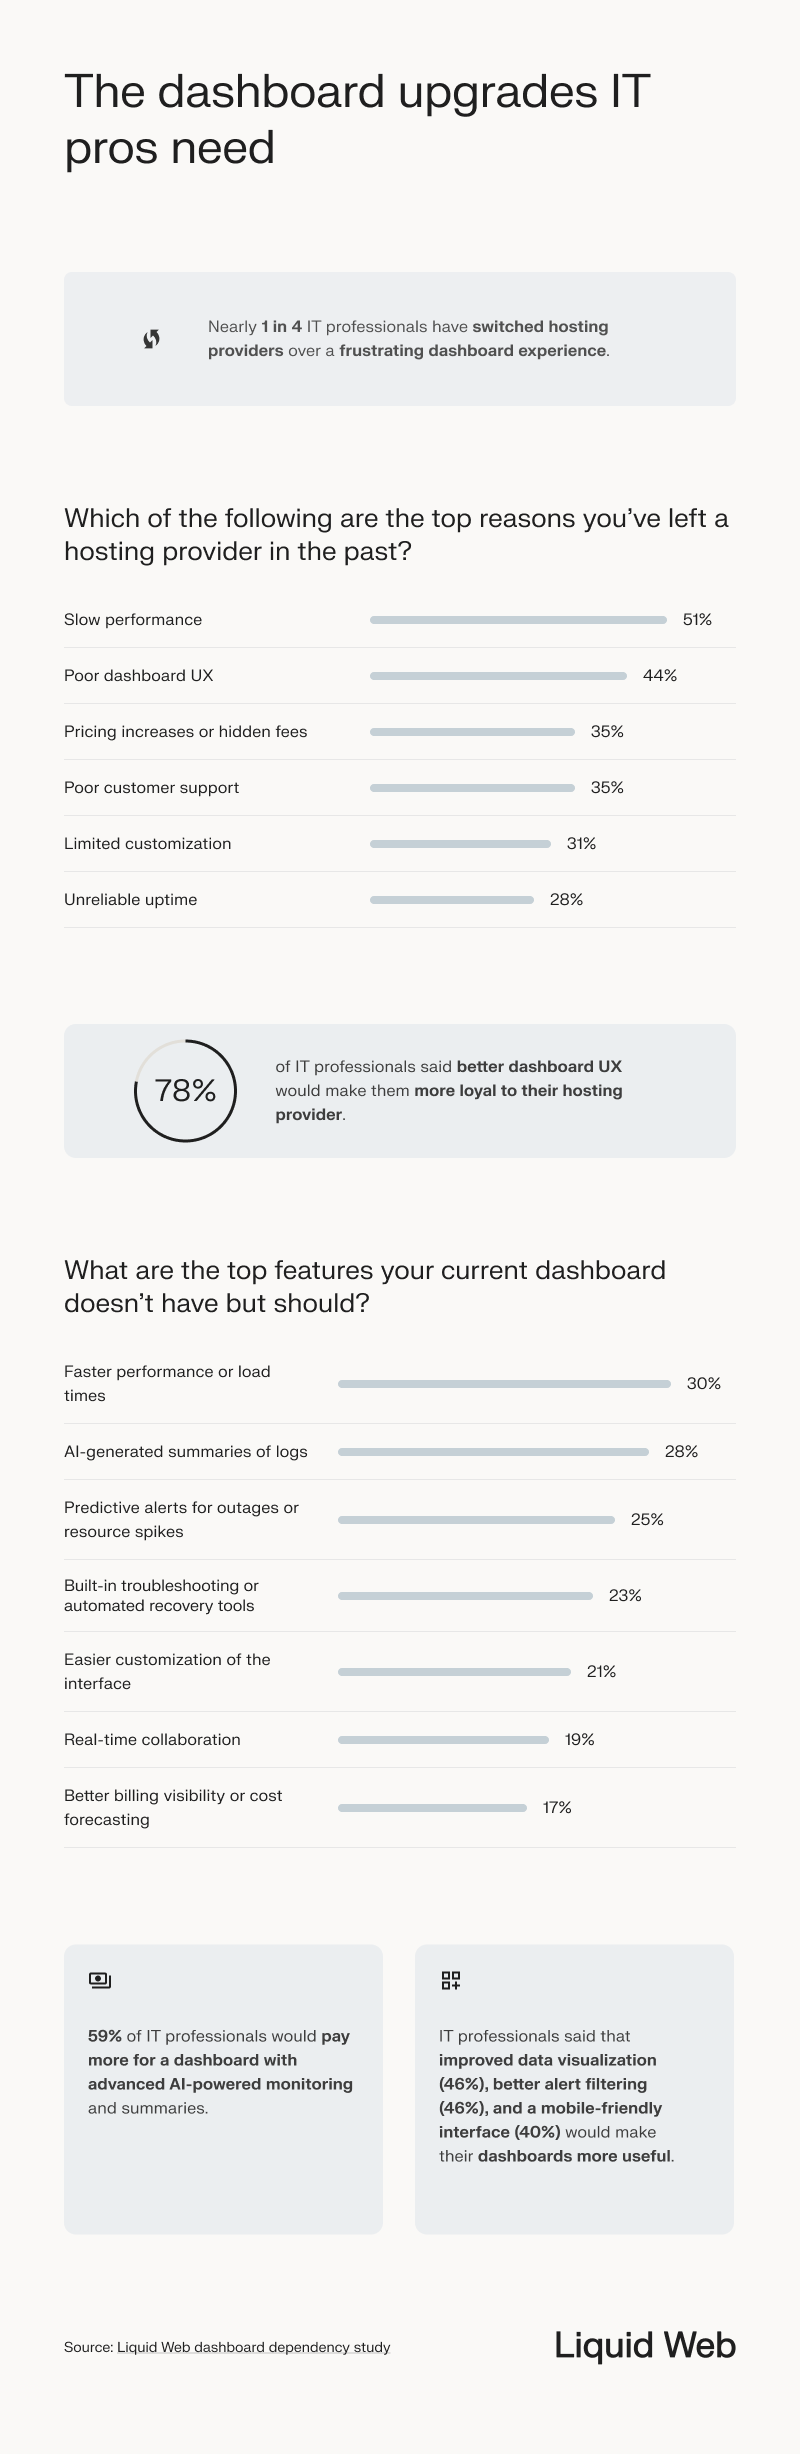
- 44% of IT professionals have left a hosting provider due to poor dashboard UX.
- 59% of IT professionals would pay more for a dashboard with advanced AI-powered monitoring and summaries.
Portal dashboard dependency and daily use
IT professionals are developing a strong, often compulsive relationship with their server or portal dashboards:
- 59% of IT professionals said past outages have made them more obsessive about checking their dashboards, even when things are fine.
- 1 in 3 said they can’t relax if they don’t check their server dashboard at least hourly.
- Over half (51%) check dashboards during nights, weekends, or vacations.
- On average, IT pros spend 77 minutes per day checking their server dashboards, which is more than 468 hours or nearly 20 full days per year.
- 3 in 10 said downtime occurred because they didn’t review their dashboard within the critical window for action.
- When asked how long they’ve ever gone without checking their server dashboard, IT pros most often said 1–2 days (28%).
- More than half (68%) haven’t gone longer than 48 hours without checking their dashboard.
What IT professionals are saying about dashboards
Based on the survey, respondents frequently commented on issues like alert fatigue, difficulty finding information, configuration challenges, and missed downtime notifications.
Here’s what they had to say.
On alert fatigue and noise:
“CPU usage spikes and disk I/O alerts create so much noise that we sometimes miss what actually matters.”
Gen Z survey respondent, female, Backend Developer
“False positives or unnecessary alerts constantly interrupt our flow. It’s exhausting.”
Gen X survey respondent, female, Backend Developer
On difficulty finding information:
“Correlating logs and performance metrics across multiple services is a nightmare. AI could save us hours.”
Millennial survey respondent, female, Backend Developer
“Finding the root cause of cascading failures, especially in noisy environments, is almost impossible without better visibility.”
Gen Z survey respondent, female, Backend Developer
On configuration challenges:
“Setting up and configuring complex systems or workflows eats up more time than it should.”
Gen X survey respondent, female, Backend Developer
“Permission setup and custom alert routing rules are unnecessarily tedious. It slows everything down.”
Gen Z survey respondent, female, Backend Developer
On missed downtime:
“We’ve had intermittent service disruptions that didn’t trigger alerts – completely blindsided us.”
Gen Z survey respondent, female, Backend Developer
“When the server crashes, and no one gets notified. That’s the kind of issue that keeps me up at night.”
Millennial survey respondent, male, Backend Developer
Portal dashboard UX friction and loyalty drivers
The top 5 reasons why IT pros stay with a hosting provider:
- Reliable uptime (58%)
- Infrastructure speed/performance (48%)
- Competitive pricing (47%)
- Fast customer support (35%)
- Good documentation/API access (28%)
Poor portal dashboard UX has consequences:
- 44% of IT professionals have left a hosting provider due to poor dashboard UX.
- 89% said it’s at least somewhat important that their dashboard lets them manage VPS, dedicated servers, and sub-accounts in one unified view.
- 69% said their dashboard contributes to their sense of control and peace of mind.
- 59% would pay more for a dashboard with advanced AI-powered monitoring and summaries.
How IT pros are reimagining the server dashboard
As AI becomes more integrated into infrastructure management, IT professionals are optimistic:
- 54% said AI-generated summaries would save them time.
- 53% said they’d help speed up incident response.
- 29% said AI summaries would improve collaboration with their team.
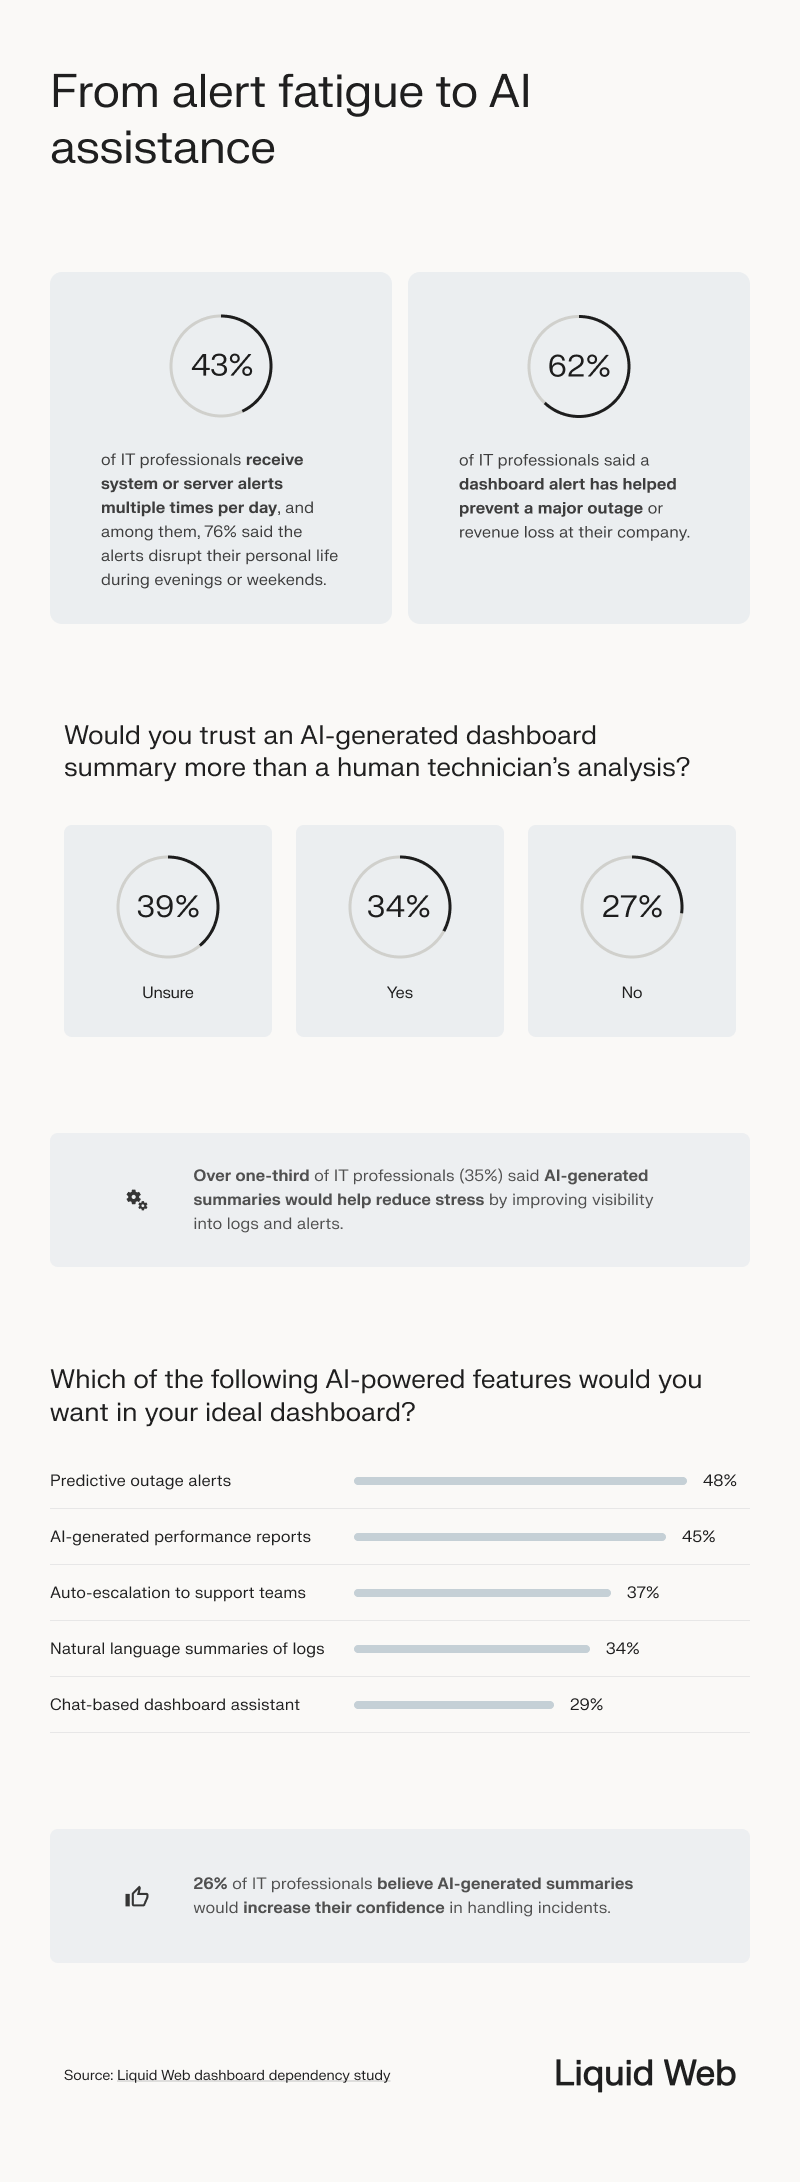
- 34% would trust an AI-generated dashboard summary more than a human technician’s analysis, 27% would trust it less, and 39% are unsure.
- 26% believe AI for server management would increase their confidence in handling incidents.
“The next generation of dashboards won’t just monitor infrastructure, they’ll restore control. If your UI causes friction, you risk losing your customers.
Dashboard design should no longer be an afterthought. Forward-looking companies must prioritize UX, unified views, and AI to boost confidence and reduce noise.”
Ryan MacDonald
Chief Technology Officer at Liquid Web

Fair use statement
This content is based on proprietary research conducted by Liquid Web and is shared here under fair use for educational and informational purposes. If you reference any part of this article, please provide proper attribution with a link back to the study so your readers can see the findings in their entirety.
Share this content
<a href="https:www.liquidweb.com/white-papers/server-dashboard-dependency-study/" target="_blank" rel="noopener noreferrer">Liquid Web study on server dashboard dependency.</a>
Learn more about this study
Preferred by the pros
Developers, sysadmins, and CTOs alike trust Liquid Web bare metal servers for their most vital workloads.