
 Mohammed Noufal
 Grafana for Linux monitoring is essential in today’s fast-paced technological environment. Visualize data for optimizing system performance, assuring reliability, and making informed decisions. AlmaLinux running on Liquid Web hardware serves as a stable and enterprise-ready Linux distribution. In fact, it is an excellent choice for hosting robust monitoring tools as well.
Grafana, an open source analytics and monitoring platform, is a vital tool. This article will look at the importance of installing Grafana on AlmaLinux, specifically its role in providing real-time insights, improving system management, and supporting data-driven decision making.
Key points
These are the central areas covered in this blog:
- What is Grafana for Linux monitoring?
- Understanding the Grafana dashboard
- How to install Grafana for Linux monitoring
- How to update Grafana
- How to uninstall or remove Grafana
- Frequently asked questions for issues encountered
What is Grafana for Linux monitoring?
Grafana is a multi-platform, open-source analytics and monitoring tool that enables users to visualize and easily understand data through customizable dashboards. It supports many data sources, including databases, cloud services, and monitoring tools.
Grafana offers a consistent interface for tracking and evaluating different data types, giving people and businesses a better understanding of their infrastructure, apps, and systems. Its user-friendly interface and extensive customization options make it a valuable tool for real-time monitoring, trend analysis, and decision-making. It improves performance, efficiency, and reliability across IT operations, DevOps, and business intelligence domains.
Understanding the Grafana dashboard
Grafana dashboards are customizable web-based interfaces that display data visualizations from various sources. They allow users to monitor and analyze data in real time. Each dashboard comprises panels representing different data sources, queries, and visualizations. Users can create, modify, and organize these dashboards to suit their monitoring needs.
Prerequisites
There are a few prerequisites to have set up prior to beginning the installation process:
- Operating system and version. AlmaLinux OS 8.
- Minimum. 512 MB RAM.
- Recommended. 2 GB for smaller installations and 8 GB or higher for larger installations.
- Access. Make sure you have root or sudo Linux permissions to install Grafana.
It belongs to you
A dedicated server not shared with any other customers, services, or applications.
Step #1. Add the Grafana RPM repository
Before we begin the Grafana installation, we must add the Grafana repository, which is not included by default in AlmaLinux. To do so, use any text editor (for example, nano) to create a Grafana repository file in the /etc/yum.repos.d/ directory.
To install Grafana for Linux monitoring on AlmaLinux, follow these steps by first issuing this command:
sudo nano /etc/yum.repos.d/grafana.repoNext, add the following details:
[grafana]
name=grafana
baseurl=https://packages.grafana.com/oss/rpm
repo_gpgcheck=1
enabled=1
gpgcheck=1
gpgkey=https://packages.grafana.com/gpg.key
sslverify=1
sslcacert=/etc/pki/tls/certs/ca-bundle.crt
Then, save and close the file.
Step #2. Update the AlmaLinux system
Before installing Grafana, we must update the AlmaLinux system packages to the most recent version. You can issue the dnf update command to update the AlmaLinux system:
sudo dnf updateStep #3. Install Grafana
To install the Grafana package on your AlmaLinux system, you can run the following dnf install grafana command:
sudo dnf install grafanaHere is the output:
]# sudo dnf install grafana
Last metadata expiration check: 0:09:27 ago on Mon 01 Jan 2024 08:42:40 AM UTC.
Dependencies resolved.
==============================================================================================================================================================================================================================================
Package Architecture Version Repository Size
==============================================================================================================================================================================================================================================
Installing:
grafana x86_64 10.2.3-1 grafana 98 M
Installing dependencies:
dejavu-fonts-common noarch 2.35-7.el8 baseos 73 k
dejavu-sans-fonts noarch 2.35-7.el8 baseos 1.5 M
fontconfig x86_64 2.13.1-4.el8 baseos 273 k
fontpackages-filesystem noarch 1.44-22.el8 baseos 16 k
Transaction Summary
==============================================================================================================================================================================================================================================
Install 5 Packages
Total download size: 100 M
Installed size: 372 M
Is this ok [y/N]: y
Downloading Packages:
(1/5): fontconfig-2.13.1-4.el8.x86_64.rpm 18 MB/s | 273 kB 00:00
(2/5): dejavu-fonts-common-2.35-7.el8.noarch.rpm 3.9 MB/s | 73 kB 00:00
(3/5): fontpackages-filesystem-1.44-22.el8.noarch.rpm 2.9 MB/s | 16 kB 00:00
(4/5): dejavu-sans-fonts-2.35-7.el8.noarch.rpm 41 MB/s | 1.5 MB 00:00
(5/5): grafana-10.2.3-1.x86_64.rpm 40 MB/s | 98 MB 00:02
----------------------------------------------------------------------------------------------------------------------------------------------------------------------------------------------------------------------------------------------
Total 39 MB/s | 100 MB 00:02
grafana 53 kB/s | 2.4 kB 00:00
Importing GPG key 0x10458545:
Userid : "Grafana Labs <[email protected]>"
Fingerprint: B53A E77B ADB6 30A6 8304 6005 963F A277 1045 8545
From : https://packages.grafana.com/gpg.key
Is this ok [y/N]: y
Key imported successfully
Running transaction check
Transaction check succeeded.
Running transaction test
Transaction test succeeded.
Running transaction
Preparing : 1/1
Installing : fontpackages-filesystem-1.44-22.el8.noarch 1/5
Installing : dejavu-fonts-common-2.35-7.el8.noarch 2/5
Installing : dejavu-sans-fonts-2.35-7.el8.noarch 3/5
Installing : fontconfig-2.13.1-4.el8.x86_64 4/5
Running scriptlet: fontconfig-2.13.1-4.el8.x86_64 4/5
Installing : grafana-10.2.3-1.x86_64 5/5
Running scriptlet: grafana-10.2.3-1.x86_64 5/5
—-
—-
POSTTRANS: Running script
Running scriptlet: fontconfig-2.13.1-4.el8.x86_64 5/5
Verifying : dejavu-fonts-common-2.35-7.el8.noarch 1/5
Verifying : dejavu-sans-fonts-2.35-7.el8.noarch 2/5
Verifying : fontconfig-2.13.1-4.el8.x86_64 3/5
Verifying : fontpackages-filesystem-1.44-22.el8.noarch 4/5
Verifying : grafana-10.2.3-1.x86_64 5/5
Installed:
dejavu-fonts-common-2.35-7.el8.noarch dejavu-sans-fonts-2.35-7.el8.noarch fontconfig-2.13.1-4.el8.x86_64 fontpackages-filesystem-1.44-22.el8.noarch grafana-10.2.3-1.x86_64
Complete!Step #4. Start and enable the Grafana system service
To start the Grafana service and enable it to start on boot, you can run the following commands:
sudo systemctl start grafana-server
sudo systemctl enable grafana-server
Here is the output:
]# sudo systemctl start grafana-server
]# sudo systemctl enable grafana-server
Synchronizing state of grafana-server.service with SysV service script with /usr/lib/systemd/systemd-sysv-install.
Executing: /usr/lib/systemd/systemd-sysv-install enable grafana-server
Created symlink /etc/systemd/system/multi-user.target.wants/grafana-server.service → /usr/lib/systemd/system/grafana-server.service.
Then, run the systemctl status grafana-server command to check the status of the Grafana service:
sudo systemctl status grafana-serverHere is the output:
]# sudo systemctl status grafana-server
● grafana-server.service - Grafana instance
   Loaded: loaded (/usr/lib/systemd/system/grafana-server.service; enabled; vendor preset: disabled)
   Active: active (running) since Mon 2024-01-01 09:16:01 UTC; 30s ago
     Docs: http://docs.grafana.org
 Main PID: 48689 (grafana)
    Tasks: 8 (limit: 11852)
   Memory: 52.2M
   CGroup: /system.slice/grafana-server.service
           └─48689 /usr/share/grafana/bin/grafana server --config=/etc/grafana/grafana.ini --pidfile=/var/run/grafana/grafana-server.pid --packaging=rpm cfg:default.paths.logs=/var/log/grafana cfg:default.paths.data=/var/lib/grafana cfg:>
Step #5. Allow the Grafana port in the AlmaLinux firewall
To allow the Grafana default port 3000 and reload the AlmaLinux firewall to reflect the changes, you can run the following commands:
sudo firewall-cmd --zone=public --add-port=3000/tcp --permanent
sudo firewall-cmd --reload
Here is the output:
]# sudo firewall-cmd --zone=public --add-port=3000/tcp --permanent
success
]# sudo firewall-cmd --reload
success
Step #6. Access the Grafana dashboard and verify the installation
To access the Grafana login page, open a web browser and go to http://<your_server_ip>:3000, where you replace the placeholder shown with you server’s actual IP address:
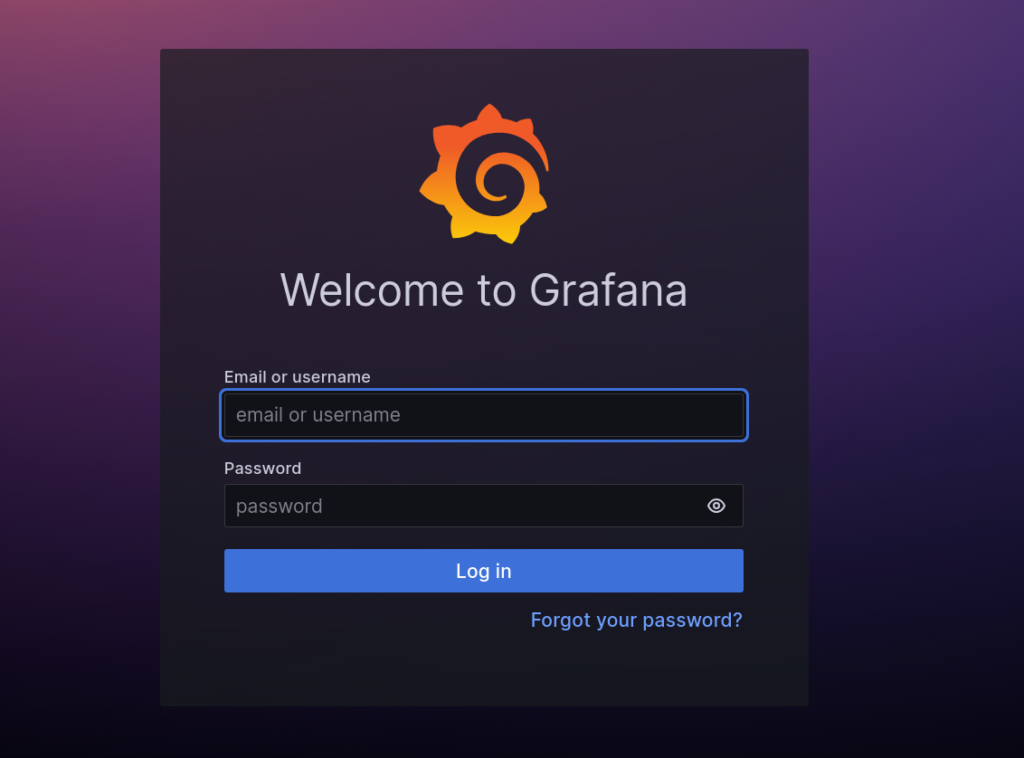
Enter the Grafana default credentials (where username and password are admin/admin) and click the Log In button:

Then, set a new secure password and click the Submit button:

You now have access to the Grafana dashboard:
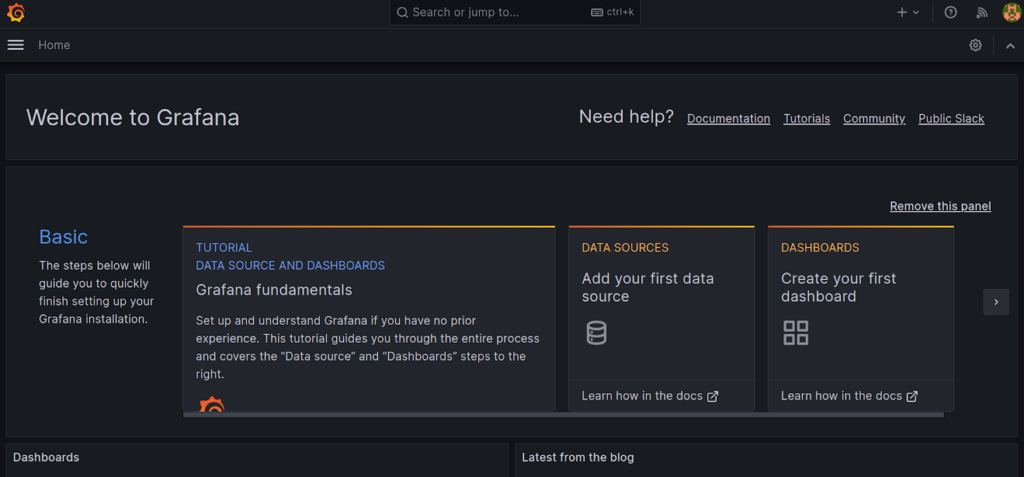
You can start monitoring data by selecting a data source and creating panels. You may get more information about it in the Grafana official documentation. If necessary, you may study the article How to install Grafana on CentOS 8 to learn more about how to install Grafana on CentOS.
Economize your hosting costs
Each VPS mimics the benefits of a dedicated server, offering enhanced security, scalability, and speed.
How to update Grafana
Updating Grafana for Linux monitoring while running can sometimes lead to issues, as the running process may still use old files or configurations. To minimize potential problems, stopping the Grafana service before updating is recommended. Also, before performing any updates, you must back up your Grafana configuration to avoid potential data loss or configuration issues.
To stop Grafana service on AlmaLinux, use the following command:
sudo systemctl stop grafana-serverTo update Grafana on AlmaLinux, use the following commands:
sudo dnf update grafanaAfter the update, use the following command to start the Grafana service:
sudo systemctl start grafana-serverThen, use the following command to check the Grafana service status:
sudo systemctl status grafana-serverHow to uninstall or remove Grafana
To uninstall or remove Grafana, use the following command:
sudo dnf remove grafanaHere is the output:
]# sudo dnf remove grafana
Dependencies resolved.
==============================================================================================================================================================================================================================================
 Package                                                             Architecture                                       Version                                                    Repository                                            Size
==============================================================================================================================================================================================================================================
Removing:
 grafana                                                             x86_64                                             10.2.3-1                                                   @grafana                                             366 M
Removing unused dependencies:
 dejavu-fonts-common                                                 noarch                                             2.35-7.el8                                                 @baseos                                              143 k
 dejavu-sans-fonts                                                   noarch                                             2.35-7.el8                                                 @baseos                                              5.4 M
 fontconfig                                                          x86_64                                             2.13.1-4.el8                                               @baseos                                              694 k
 fontpackages-filesystem                                             noarch                                             1.44-22.el8                                                @baseos                                                0

Transaction Summary
==============================================================================================================================================================================================================================================
Remove  5 Packages

Freed space: 372 M
Is this ok [y/N]: y
Running transaction check
Transaction check succeeded.
Running transaction test
Transaction test succeeded.
Running transaction
  Preparing        :                                                                                                                                                                                                                      1/1
  Running scriptlet: grafana-10.2.3-1.x86_64                                                                                                                                                                                              1/1
  Erasing          : grafana-10.2.3-1.x86_64                                                                                                                                                                                              1/5
  Running scriptlet: grafana-10.2.3-1.x86_64                                                                                                                                                                                              1/5
  Erasing          : fontconfig-2.13.1-4.el8.x86_64                                                                                                                                                                                       2/5
  Erasing          : dejavu-sans-fonts-2.35-7.el8.noarch                                                                                                                                                                                  3/5
  Erasing          : dejavu-fonts-common-2.35-7.el8.noarch                                                                                                                                                                                4/5
  Erasing          : fontpackages-filesystem-1.44-22.el8.noarch                                                                                                                                                                           5/5
  Running scriptlet: fontpackages-filesystem-1.44-22.el8.noarch                                                                                                                                                                           5/5
  Verifying        : dejavu-fonts-common-2.35-7.el8.noarch                                                                                                                                                                                1/5
  Verifying        : dejavu-sans-fonts-2.35-7.el8.noarch                                                                                                                                                                                  2/5
  Verifying        : fontconfig-2.13.1-4.el8.x86_64                                                                                                                                                                                       3/5
  Verifying        : fontpackages-filesystem-1.44-22.el8.noarch                                                                                                                                                                           4/5
  Verifying        : grafana-10.2.3-1.x86_64                                                                                                                                                                                              5/5

Removed:
  dejavu-fonts-common-2.35-7.el8.noarch              dejavu-sans-fonts-2.35-7.el8.noarch              fontconfig-2.13.1-4.el8.x86_64              fontpackages-filesystem-1.44-22.el8.noarch              grafana-10.2.3-1.x86_64

Complete!
To remove its configuration files, use the following command:
sudo rm -r /etc/grafana /var/lib/grafana /var/log/grafanaThe -r flag stands for recursive, and it will remove the directories and their contents.
Frequently asked questions for issues encountered
Closing thoughts
With the help of this post, you will now be able to install Grafana for Linux monitoring on AlmaLinux easily. Depending on your precise resource requirements, we offer a customized plan for deploying Grafana on Liquid Web servers running AlmaLinux on our cloud VPS and dedicated server hosting plans.
Cloud VPS is a fantastic solution for flexibility and scalability because it allows you to alter resources as needed instantly. Dedicated server hosting provides robust performance and dedicated hardware if you anticipate higher resource demands. Both options can be configured with AlmaLinux as the operating system, ensuring compatibility with Grafana.
For streamlined management, consider adding cPanel/WHM to either hosting solution. Liquid Web’s support team stands ready 24/7 to assist with server-related tasks, offering a reliable and secure environment for a successful Grafana installation on either VPS or dedicated servers.