


Tag: Monitoring
How to Monitor Your Server in WHM
In this article we will briefly cover the basics of monitoring your server via WHM. By following this process you will learn how to find: service status, resource usage, and Apache stats.
What is Infrastructure as Code? (IaC)
Introduction: What is IaC?
Today we will become acquainted with a concept known as Infrastructure as Code. The idea of Infrastructure as Code is becoming more and more popular today. IaC is a method used to manage and provision a data center via defined machine-readable files instead of physical hardware configuration or other interactive configuration tools. This article will share what it is used for, why it is important, and why businesses strive to utilize this platform to achieve a desired set of results. It is essential to understand that we will consider both the theoretical and practical parts of IaC.
DevOps: A New Perspective on Shared Automation
What is DevOps?
DevOps is a set of various tools, practices, and ideals that combine software development (Dev) and IT Operations (Ops) into a single unifying force. It allows for better collaboration between developers, operations teams, system administrators, and system engineers. Their streamlined goal is to continually provide a high-value software product to the customer at high speed while monitoring and improving the overall process than using traditional software and infrastructure management.
What is a Service Mesh?
What is Service Mesh?
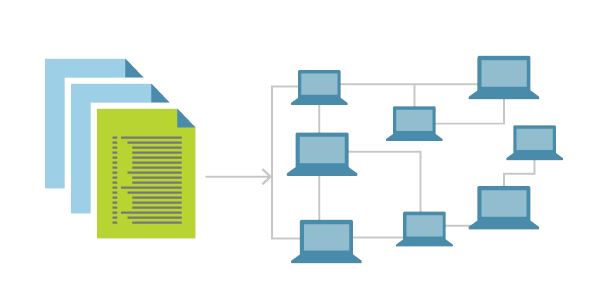
A service mesh is an additional infrastructure layer that provides a means of communication between all services in a given application. It is typically deployed as a series of proxies alongside each service instance. Since the service mesh proxies are deployed alongside the application services and not as part of it, they are often referred to as sidecars. This means that as a whole, these sidecar proxies are a mesh network and an infrastructure layer separate from the application. A service mesh not only brokers communication between all services in an application but, since all requests, both internal and external, pass through it, it provides a means for handling many tasks that can be obfuscated away from the application.
How to Install and Configure Chef on Ubuntu 18.04
Introduction
In this article, we will be reviewing the Chef software, how it works, and why it is useful. We will also explore how it is helpful in DevOps. And then, we will install Chef on Ubuntu 18.04.
What is Configuration Management?

Configuration management is the process by which a company or organization defines and tracks the state of its infrastructural resources. Encapsulated in those resources are both physical hardware and software. It is a means to ensure that when changes are made to a system, those changes are tracked, geared toward the ultimate predefined criteria of what state should be.
What is High Availability? A Tutorial

High availability is the description of a system designed to be fault-tolerant, highly dependable, operates continuously without intervention, or having a single point of failure. These systems are highly sought after to increase the availability and uptime required to keep an infrastructure running without issue. The following characteristics define a High Availability system.
How to Install and Configure Nmcli
What is nmcli?
nmcli stands for Network Management Command-Line Interface, and is a tool for managing the NetworkManager application and reporting on the status of the network. It can be utilized as a substitution for nm-applet or other similar graphical clients. nmcli is used to display, create, delete, edit, activate, deactivate network connections, and control and display network device status.
How To Change the SNMP Port on CentOS
Introduction
SNMP, or Simple Network Management Protocol, is widely used to communicate with and monitor network devices, servers, and more, all via IP. In the previous article, we installed an SNMP agent on a CentOS 6.5 server. This agent allows for the collection of data from our server and makes the information available to a remote SNMP manager. To add a little security, we'll now change the port that SNMP listens on.
How To Install Grafana on CentOS 8
What is Grafana?
This article is a step-by-step guide on how to install Grafana software on CentOS 8 server. Grafana is a popular open-source visualization and analytics monitoring software. It renders graphs, charts, and alerts when connected to supported data sources. It is commonly used with time series databases like Prometheus, SQL databases like MySQL logging, and document databases like Loki, etc. You can additionally install hundreds of plugins and dashboards from the official library.
Our Sales and Support teams are available 24 hours by phone or e-mail to assist.