


How To Install Grafana on CentOS 8
What is Grafana?
This article is a step-by-step guide on how to install Grafana software on CentOS 8 server. Grafana is a popular open-source visualization and analytics monitoring software. It renders graphs, charts, and alerts when connected to supported data sources. It is commonly used with time series databases like Prometheus, SQL databases like MySQL logging, and document databases like Loki, etc. You can additionally install hundreds of plugins and dashboards from the official library.
Installation
As always, it is recommended to update our servers software before any new tool is installed. If the server has not been updated for some time, it may take a couple of minutes to update all the packages. Through this installation process, I will be signed in as a root user and you should be to.
[root@host ~]# dnf update
Last metadata expiration check: 0:54:47 ago on Fri Apr 17 09:40:56 2020.
Dependencies resolved.
Nothing to do.
Complete!
[root@host ~]#

[root@host ~]# yum update
Last metadata expiration check: 0:55:22 ago on Fri Apr 17 09:40:56 2020.
Dependencies resolved.
Nothing to do.
Complete!
[root@host ~]#
After the server is updated, we will create a new file called “grafana.repo” in /etc/yum.repos.d/grafana.repo to add the Grafana repositories to our local YUM repository.
touch grafana.repoNext, we will run the following command to add the repository to our /etc/yum.repos.d/grafana.repo file. The command should look like this.
cat <<EOF | sudo tee /etc/yum.repos.d/grafana.repo
[grafana]
name=grafana
baseurl=https://packages.grafana.com/oss/rpm
repo_gpgcheck=1
enabled=1
gpgcheck=1
gpgkey=https://packages.grafana.com/gpg.key
sslverify=1
sslcacert=/etc/pki/tls/certs/ca-bundle.crt
EOF
The "Baseurl" we used above will determine which version of Grafana are we going to install. In this case we utilized "baseurl
If we want to install the Enterprise version, we would use this baseurl accordingly: "baseurl
Next, we need to run another update add Grafana the repo and to import the GPG key. You will be asked if you want to import the GPG key from Grafana, enter “y” and continue.
[root@host ~]# dnf update
grafana                     1.1 kB/s | 488  B     00:00
grafana                     17 kB/s | 1.7 kB     00:00
Importing GPG key 0x24098CB6:
 Userid     : "Grafana <info@grafana.com>"
 Fingerprint: 4E40 DDF6 D76E 284A 4A67 80E4 8C8C 34C5 2409 8CB6
 From       : https://packages.grafana.com/gpg.key
Is this ok [y/N]: y
grafana                     2.4 MB/s | 2.5 MB     00:01
Last metadata expiration check: 0:00:01 ago on Fri Apr 17 14:56:02 2020.
Dependencies resolved.
Nothing to do.
Complete!
[root@host ~]#
Now, we will run one of the following commands to install Grafana:
[root@host ~]# dnf install grafanaor
[root@host ~]# dnf install grafana-enterprisePress “y” when you are asked if you want to install Grafana. You will again be asked if you want to import the GPG key from Grafana, hit “y” to proceed with the installation.
[root@host ~]# dnf install grafana
Last metadata expiration check: 0:02:30 ago on Fri Apr 17 14:56:02 2020.
Dependencies resolved.
============================================================================
 Package                    Architecture     Version             Repository           Size
============================================================================
Installing:
 grafana                     x86_64           6.7.2-1            grafana              61 M
Installing dependencies:
 libICE                      x86_64           1.0.9-15.el8       AppStream            74 k
 libSM                       x86_64           1.2.3-1.el8

Transaction Summary
============================================================================
Install  37 Packages

Total download size: 70 M
Installed size: 194 M
Is this ok [y/N]: y
Downloading Packages:
(1/37): libSM-1.2.3-1.el8.x86_64.rpm                    74 kB/s |  48 kB     00:00
(2/37): libICE-1.0.9-15.el8.x86_64.rpm                  93 kB/s |  74 kB     00:00
(3/37): libXau-1.0.8-13.el8.x86_64.rpm                  76 kB/s |  36 kB     00:00
(4/37): libX11-common-1.6.7-1.el8.noarch.rpm            176 kB/s | 157 kB     00:00

----------------------------------------------------------------------------
Total                                                   4.5 MB/s |  70 MB     00:15
warning: /var/cache/dnf/grafana-13e251e56a0c8862/packages/grafana-6.7.2-1.x86_64.rpm: Header V4 RSA/SHA512 Signature, key ID 24098cb6: NOKEY
grafana                                                 13 kB/s | 1.7 kB     00:00
Importing GPG key 0x24098CB6:
 Userid     : "Grafana <info@grafana.com>"
 Fingerprint: 4E40 DDF6 D76E 284A 4A67 80E4 8C8C 34C5 2409 8CB6
 From       : https://packages.grafana.com/gpg.key
Is this ok [y/N]: y
Key imported successfully
Running transaction check

  Installing       : grafana-6.7.2-1.x86_64             37/37
  Running scriptlet: grafana-6.7.2-1.x86_64             37/37
### NOT starting on installation, please execute the following statements to configure grafana to start automatically using systemd
 sudo /bin/systemctl daemon-reload
 sudo /bin/systemctl enable grafana-server.service
### You can start grafana-server by executing
 sudo /bin/systemctl start grafana-server.service

Installed:
  grafana-6.7.2-1.x86_64                                  libICE-1.0.9-15.el8.x86_64
  libSM-1.2.3-1.el8.x86_64                                libX11-1.6.7-1.el8.x86_64
  libX11-common-1.6.7-1.el8.noarch                        libXau-1.0.8-
  xorg-x11-server-utils-7.7-27.el8.x86_64                 fontconfig-2.13.1-3.el8.x86_64
  fontpackages-filesystem-1.44-22.el8.noarch

Complete!
[root@host ~]#
As you can see in the output above, Grafana will not start automatically at system boot. To remedy this, we will start and then check the status of the Grafana service using the following commands. The final step below is to configure Grafana to start on system boot if necessary:
[root@host ~]# systemctl daemon-reload

[root@host ~]# systemctl start grafana-server

[root@host ~]# systemctl status grafana-server
● grafana-server.service - Grafana instance
   Loaded: loaded (/usr/lib/systemd/system/grafana-server.service; disabled; vendor preset: disabled)
   Active: active (running) since Fri 2020-04-17 15:06:07 EDT; 12s ago
     Docs: http://docs.grafana.org
 Main PID: 4870 (grafana-server)
    Tasks: 9 (limit: 10686)
   Memory: 20.6M
   CGroup: /system.slice/grafana-server.service
           └─4870 /usr/sbin/grafana-server --config=/etc/grafana/grafana.ini --pidfile=/var/run/grafana/grafana-server.>

Apr 17 15:06:07 host.lwkbcentos2.com grafana-server[4870]: t=2020-04-17T15:06:07-0400 lvl=info msg="Initializing Tracin>
Apr 17 15:06:07 host.lwkbcentos2.com grafana-server[4870]: t=2020-04-17T15:06:07-0400 lvl=info msg="Initializing UsageS>
Apr 17 15:06:07 host.lwkbcentos2.com grafana-server[4870]: t=2020-04-17T15:06:07-0400 lvl=info msg="Initializing CleanU>
Apr 17 15:06:07 host.lwkbcentos2.com grafana-server[4870]: t=2020-04-17T15:06:07-0400 lvl=info msg="Initializing Notifi>
Apr 17 15:06:07 host.lwkbcentos2.com grafana-server[4870]: t=2020-04-17T15:06:07-0400 lvl=info msg="Initializing provis>
Apr 17 15:06:07 host.lwkbcentos2.com grafana-server[4870]: t=2020-04-17T15:06:07-0400 lvl=info msg="Backend rendering v>
Apr 17 15:06:07 host.lwkbcentos2.com grafana-server[4870]: t=2020-04-17T15:06:07-0400 lvl=warn msg="phantomJS is deprec>
Apr 17 15:06:07 host.lwkbcentos2.com grafana-server[4870]: t=2020-04-17T15:06:07-0400 lvl=info msg="Initializing Stream>
Apr 17 15:06:07 host.lwkbcentos2.com grafana-server[4870]: t=2020-04-17T15:06:07-0400 lvl=info msg="HTTP Server Listen">
Apr 17 15:06:07 host.lwkbcentos2.com systemd[1]: Started Grafana instance.

[root@host ~]# systemctl enable grafana-server.service
Synchronizing state of grafana-server.service with SysV service script with /usr/lib/systemd/systemd-sysv-install.
Executing: /usr/lib/systemd/systemd-sysv-install enable grafana-server
Created symlink /etc/systemd/system/multi-user.target.wants/grafana-server.service → /usr/lib/systemd/system/grafana-server.service.
[root@host ~]#
Adding Firewall Rule
Because Grafana operates on the default port of 3000, we will need to open that port in the firewall. This is required to access to the Grafana web interface. To open port 3000 on CentOS server run the following command.
[root@host ~]# firewall-cmd --add-port=3000/tcp --permanent
success
[root@host ~]# firewall-cmd --reload
success
[root@host ~]#
Let's verify that port 3000 is now opened.
[root@host ~]# firewall-cmd --list-all | grep 3000
  ports: 3000/tcp
[root@host ~]#
Grafana File Locations
Lastly, Grafana install files to the following default locations.
- The default environment vars file is located at /etc/sysconfig/grafana-server
- The default binary install is located at /usr/sbin/grafana-server
- The default systemd service (if systemd is available) is named grafana-server.service
- The default init.d script is located at /etc/init.d/grafana-server
- The default configuration file location is /etc/grafana/grafana.ini
- The default configuration uses a log file located at /var/log/grafana/grafana.log
- The default configuration specifies using a sqlite3 database located at /var/lib/grafana/grafana.db
- The homepath is located in /usr/share/grafana/
Error Resolution
If you get the error:
"Grafana-server Init Failed: Could not find config defaults, make sure homepath command line parameter is set or working directory is homepath"
run the following command to set the correct homepath.
[root@host ~]# grafana-server -homepath /usr/share/grafana/If you get the error: This site can’t provide a secure connection, use vim to open the grafana.ini file and find the following option http_port = 3000 and uncomment the line out.
[root@host ~]# vim /etc/grafana/grafana.ini

# The http port  to use
# http_port = 3000

change to

# The http port  to use
 http_port = 3000
Now you can access the Grafana user interface via the link http://se.rv.er.ip:3000. We can now log in to begin configuring our first Grafana server.
Grafana Log In
The next step is to log into the Grafana dashboard. The default username and password are:
- User: Admin
- Password: Admin
Then, click the "Log In" button.

Once you log in, you will be presented with a change password screen.

Update the dashboard password and then click the "Save" button.
The screen that opens will be the Grafana dashboard.
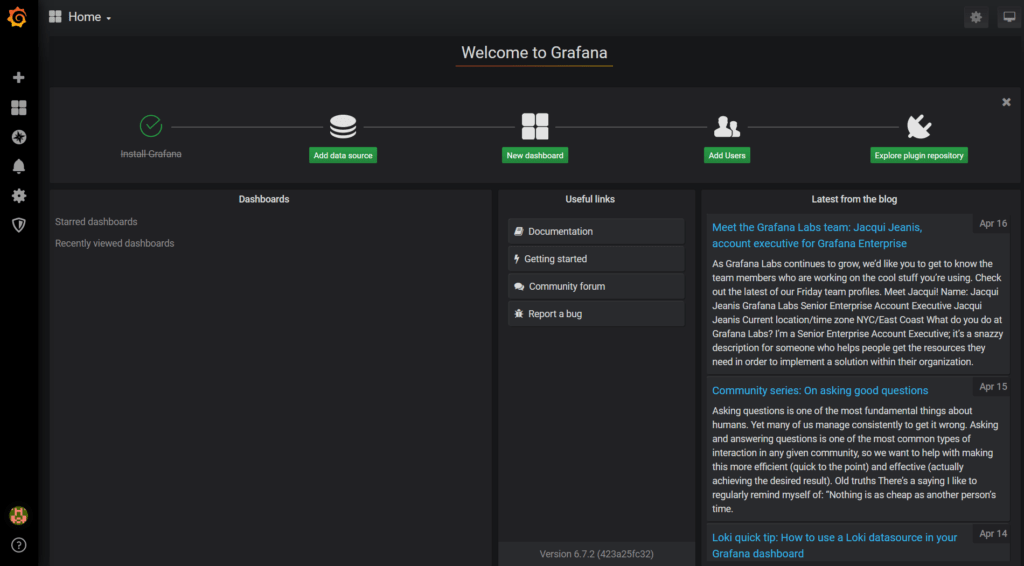
Create A Dashboard
The next steps will get you started with configuring Grafana.
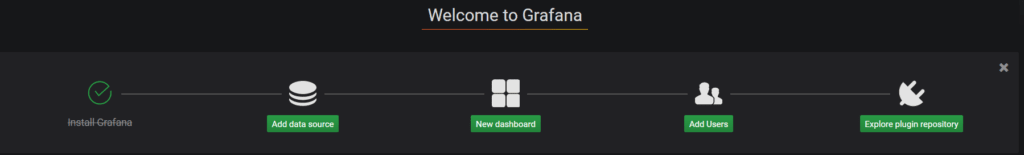
- Click New dashboard.
- Then, select Add Query. This tells Grafana to create a basic graph panel using the Random Walk scenario.
- Lastly, save the new dashboard by clicking on the "Save dashboard" icon in the top corner of the screen.
Conclusion
And that's it! You now have Grafana set up with a basic configuration! Go ahead and explore the settings and what you have built, and then expand its functionality by adding another data source, or explore the next steps at Grafana.
Get Started Today!
Give us a call at 800.580.4985, or open a chat or ticket with us to speak with one of our knowledgeable Solutions or Experienced Hosting advisors to learn how you can take advantage of this technology today!
Related Articles:


About the Author: Leo Porter
I am a 26 years old Linux Technician with almost 2-year experience, learning new things every day. I love troubleshooting and the empowering feeling you get when you help someone to resolve the issue. I like to spend my free time watching Netflix, training in Krav Maga, cycling, or camping if the weather is nice.


Our Sales and Support teams are available 24 hours by phone or e-mail to assist.
Latest Articles
How to use kill commands in Linux
Read ArticleChange cPanel password from WebHost Manager (WHM)
Read ArticleChange cPanel password from WebHost Manager (WHM)
Read ArticleChange cPanel password from WebHost Manager (WHM)
Read ArticleChange the root password in WebHost Manager (WHM)
Read Article