Server Monitoring Services
Making sure your server is functioning correctly is almost as important as the initial setup process. There are lots of third party services out there for monitoring your server and services (you can learn all about server monitoring in our article A beginner’s guide to server monitoring), but Liquid Web makes powerful server monitoring tools available right in your Liquid Web account!
Server monitoring services
On the server details page for any server (the “home” page that appears when you click a servers name in your account portal), you will find an Overall Performance graph. 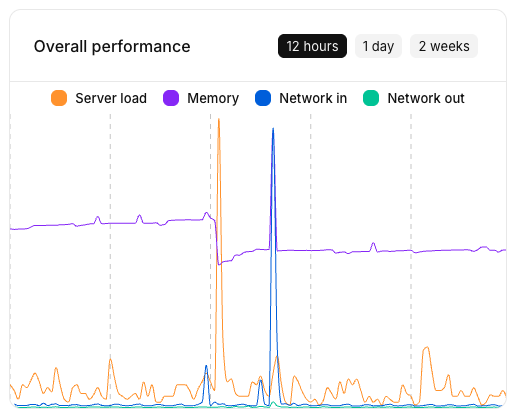
The graph shows server load, memory, and network activity on the server over the last 12 hours to 2 weeks, depending on which choice is selected. You can see other time views by clicking on the buttons in the graph.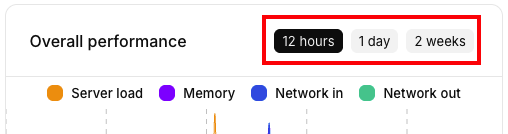
You can float the cursor over the graph to see detailed information about any specific point in time on the graph.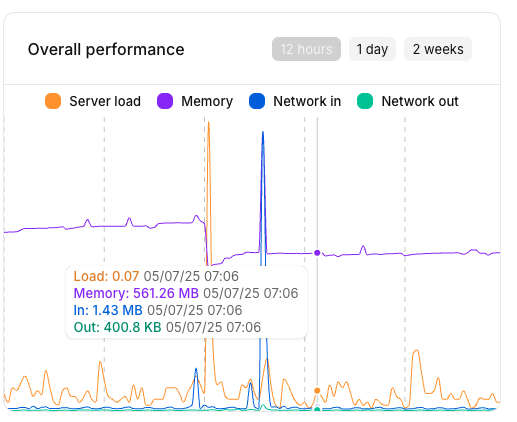
Monitoring Tab
Clicking the Monitoring tab provides additional information about our server monitoring services and lets you adjust monitoring settings per server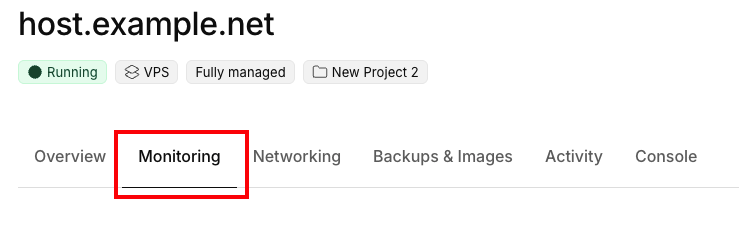
You’ll find a larger version of the Overall performance graph from the Server Details page. It functions the same as the graph on the main Server Details page.
Additionally, each component of the Overall Performance graph is displayed in its own dedicated graph, with the same time range options, allowing you to isolate load, traffic, or memory.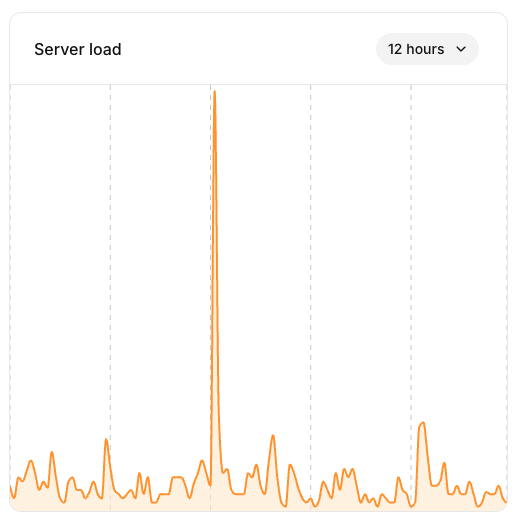
Monitoring Settings
Liquid Web offers the ability to enable server monitoring services on a number of standard web hosting services. Depending on the support level of the account, our monitoring team may be able to resolve issues with malfunctioning services before you even notice a problem.
Activating Monitoring
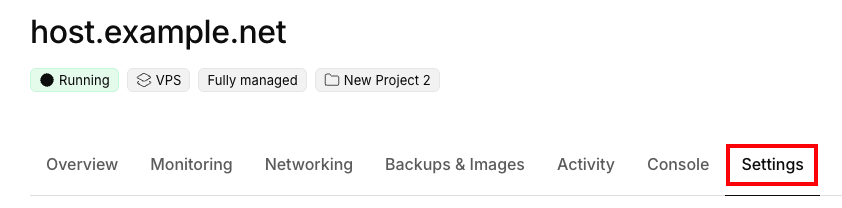
The various services that can be monitored on your server are listed in the Settings tab. First click on the Settings tab on the right side of the Server Details page. Then click on Monitored Services.
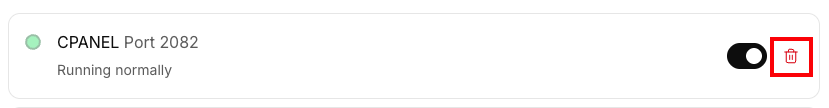
In the Monitored Services block, you can see which ports are currently being monitored and their current status.
- Ports that are monitored and are responding normally will show a green indicator. Ports that are not responding normally will be highlighted and indicate that problems are detected.
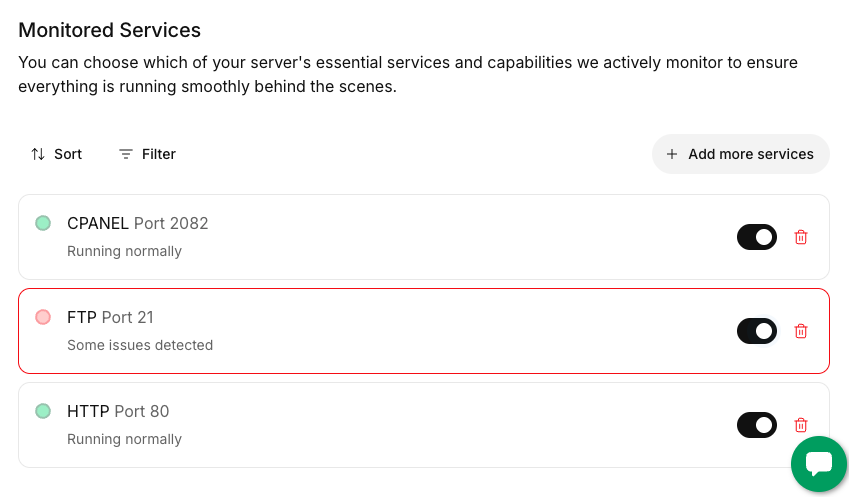
You can toggle monitoring on and off for any of the currently monitored services. For instance, if you plan to disable FTP temporarily but don’t want notifications about our monitoring detecting an outage, you can disable until you are done with your work.
Adding additional services to the monitoring list
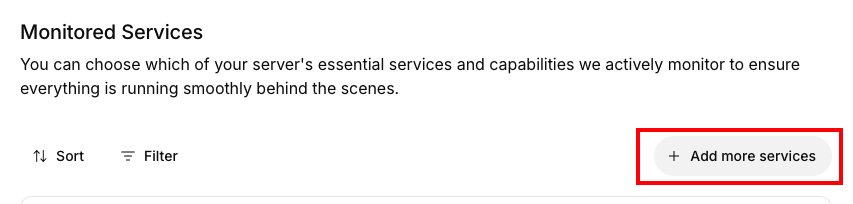
If you would like to monitor more services on your server, click the Add more services button.
Now you can add or remove any of the standard ports that Liquid Web monitors. You can add all of the available monitoring services by clicking the Add all button.
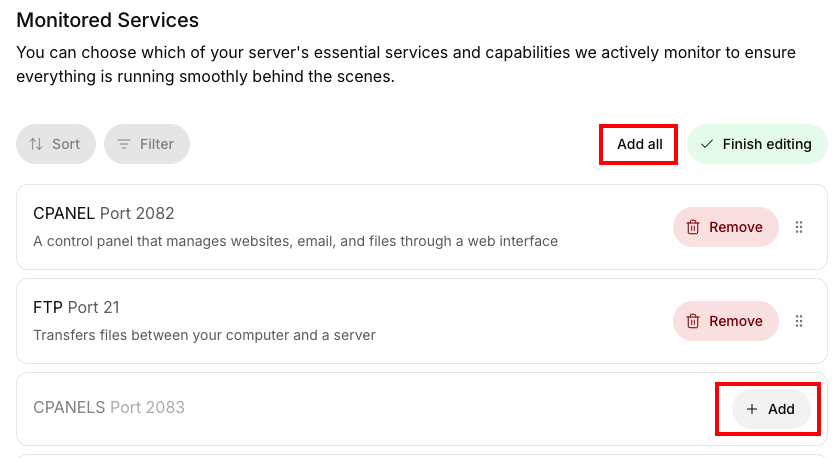
You can permanently remove a service from the monitoring page by clicking the trash can icon to the right of the service. This has no effect on the actual service on your server, it simply removes it from our monitoring system so that neither you nor our team will be notified if there are any issues with the service.