How to install Kibana on Linux (AlmaLinux)
Installing Kibana on AlmaLinux can enhance your data analysis and visualization capabilities with regard a wide range of your website’s metrics. With a focus on website owners who host using Liquid Web’s products, including cloud hosting, dedicated hosting, and VPS hosting, this help article will take you through setting up Kibana on AlmaLinux, ensuring seamless integration with Elasticsearch.
You can access the Kibana dashboard and harness its features to better understand and interact with your data. Whether you want to download Kibana or configure it with Elasticsearch, this article provides the necessary steps for a successful installation.
Key points in this post
This help documentation article goes into more depth regarding the following themes:
- What is Kibana?
- Steps for installing Kibana on AlmaLinux
- Configuring your Kibana software after installation
- How to use Kibana
- How to update Kibana
- How to uninstall Kibana
What is Kibana?
Kibana is an open source tool designed to visualize and explore data stored in Elasticsearch. It provides powerful capabilities for creating interactive charts, graphs, and maps, making it easier to analyze complex datasets and gain insights in real time. By integrating with Elasticsearch, Kibana allows users to search and analyze data effectively, offering a comprehensive view of their information.
In today’s data-driven world, Kibana with Elasticsearch stands out for its real time analytics and user-friendly interface, making it a preferred choice for businesses and organizations. Compared to other visualization tools, Kibana is cost-effective and seamlessly integrates with Elasticsearch, offering an accessible way to manage and interpret large volumes of data. This combination of Kibana and AlmaLinux provides a powerful, efficient, and cost-effective solution for modern data visualization and analysis needs, ensuring reliable performance and minimizing costs while maximizing data insights.
Prerequisites
- Operating system. AlmaLinux 8 installed on your Liquid Web server.
- SSH access. The SSH access of root or sudo access is required for installation.
- Elasticsearch. To install Elasticsearch, please refer to the article How to install Elasticsearch on Linux (AlmaLinux)
To install Kibana on AlmaLinux, please follow the steps provided.
Step #1. Access your Liquid Web server
To install Kibana on your Liquid Web server, follow these steps to access the server via SSH.
1.1. Open the Terminal or Command Prompt depending on the operating system
In order to get started, you will need to work from the proper tool within your OS:
- Mac/Linux. Launch the Terminal application from your Applications menu.
- Windows. Launch Command Prompt by searching for it in the start menu.
1.2. Connect to your Liquid Web server
Run the SSH command followed by your server’s IP address or hostname. Replace your_username with the SSH username provided by Liquid Web and your_server_ip with your server’s IP address or hostname:
ssh your_username@your_server_ip1.3. Enter your password
To authenticate on your Liquid Web server, you must input your SSH password.
1.4. Verify your connection
Once you’ve successfully connected, you’ll get a command prompt indicating that you’re logged in using SSH.
Step #2. Update your AlmaLinux system
Before installing Kibana, you must update your Liquid Web server’s operating system for optimal security and performance. On AlmaLinux, you can do this by running the dnf update command:
sudo dnf updateStep #3. Import the Elastic PGP key
Follow the steps provided to complete the import the Elastic PGP key.
3.1. Perform the import step
To ensure the packages you’re installing are genuine, import the Elastic PGP key using this command:
sudo rpm --import https://artifacts.elastic.co/GPG-KEY-elasticsearchThis command imports the Elastic PGP key used to verify the integrity of the Kibana installation files.
3.2. Verify the key was imported
To verify that the key has been imported correctly, you can list the imported keys and look for the Elastic PGP key:
rpm -qi gpg-pubkey | awk '/Elasticsearch/,/END PGP/'This command will display the imported Elastic PGP key details, capturing the entire key block up to the “END PGP” marker. Here is the output:
[root@test ~]# rpm -qi gpg-pubkey | awk '/Elasticsearch/,/END PGP/'
Packager    : Elasticsearch (Elasticsearch Signing Key) <dev_ops@elasticsearch.org>
Summary     : gpg(Elasticsearch (Elasticsearch Signing Key) <dev_ops@elasticsearch.org>)
Description :
-----BEGIN PGP PUBLIC KEY BLOCK-----
Version: rpm-4.14.3 (NSS-3)

mQENBFI3HsoBCADXDtbNJnxbPqB1vDNtCsqhe49vFYsZN9IOZsZXgp7aHjh6CJBD
A+bGFOwyhbd7at35jQjWAw1O3cfYsKAmFy+Ar3LHCMkV3oZspJACTIgCrwnkic/9
CUliQe324qvObU2QRtP4Fl0zWcfb/S8UYzWXWIFuJqMvE9MaRY1bwUBvzoqavLGZ
j3SF1SPO+TB5QrHkrQHBsmX+Jda6d4Ylt8/t6CvMwgQNlrlzIO9WT+YN6zS+sqHd
1YK/aY5qhoLNhp9G/HxhcSVCkLq8SStj1ZZ1S9juBPoXV1ZWNbxFNGwOh/NYGldD
2kmBf3YgCqeLzHahsAEpvAm8TBa7Q9W21C8vABEBAAG0RUVsYXN0aWNzZWFyY2gg
KEVsYXN0aWNzZWFyY2ggU2lnbmluZyBLZXkpIDxkZXZfb3BzQGVsYXN0aWNzZWFy
Y2gub3JnPokBTgQTAQgAOAIbAwIXgBYhBEYJWsyFSFgsGiaZqdJ9ZmzYjkK0BQJk
9vrZBQsJCAcDBRUKCQgLBRYCAwEAAh4FAAoJENJ9ZmzYjkK00hoH+wYXZKgVb3Wv
4AA/+T1IAf7edwgajr58bEyqds6/4v6uZBneUaqahUqMXgLFRX5dBSrAS7bvE/jx
+BBQx+rpFGxSwvFegRevE1zAGVtpgkFQX0RpRcKSmksucSBxikR/dPn9XdJSEVa8
vPcs11V+2E5tq3LEP14zJL4MkJKQF0VJl5UUmKLS7U2F/IB5aXry9UWdMTnwNntX
kl2iDaViYF4MC6xTS24uLwND2St0Jvjt+xGEwbdBVvp+UZ/kG6IGkYM5eWGPuok/
DHvjUdwTfyO9b5xGbqn5FJ3UFOwB/nOSFXHM8rsHRT/67gHcIl8YFqSQXpIkk9D3
dCY+KieW0ue5AQ0EUjceygEIAOSVJc3DFuf3LsmUfGpUmnCqoUm76Eqqm8xynFEG
ZpczTChkwARRtckcfa/sGv376j+jk0c0Q71Uv3MnMLPGF+w3bpu8fLiPeW/cntf1
8uZ6DxJvHA/oaZZ6VPjwUGSeVydiPtZfTYsceO8Dxl3gpS6nHZ9Gsnfr/kcH9/11
Ca73HBtmGVIkOI1mZKMbANO8cewY/i7fPxShu7B0Rb3jxVNGUuiRcfRiao0gWx0U
ZGpvuHplt7loFX2cbsHFAp9WsjYEbSohb/Y0K4NkyFhL82MfbcsEwsXPhRTFgJWw
s4vpuFg/kFFlnw0NNPVP1jNJLNCsMBMEpP1A7k6MRpylNnUAEQEAAYkBNgQYAQgA
IAIbDBYhBEYJWsyFSFgsGiaZqdJ9ZmzYjkK0BQJk9vsHAAoJENJ9ZmzYjkK0hWsH
/ArKtn12HM3+41zYo9qO4rTri7+IYTjSB/JDTOusZgZLd/HCp1xQo4SI2Eur3Rtx
USMWK1LEeBzsjwDT9yVceYekrBEqUVyRMSVYj+UeZK2s4LbXm9b4jxXVtaivmkMA
jtznndrD7kmm8ak+UsZplf6p6uZS9TZ9hjwoMmw5oMaS6TZkLT4KYGWeyzHJSUBX
YikY6vssDQu4SJ07m1f4Hz81J39QOcHln5I5HTK8Rh/VUFcxNnGg9360g55wWpiF
eUTeMyoXpOtffiUhiOtbRYsmSYC0D4Fd5yJnO3n1pwnVVVsM7RAC22rc5j/Dw8dR
GIHikRcYWeXTYW7veewK5Ss=
=ftS0
-----END PGP PUBLIC KEY BLOCK-----
Step #4. Add the Kibana repository
Create a file for the Kibana repository to get the installation package:
sudo tee /etc/yum.repos.d/kibana.repo <<EOF
[kibana-8.x]
name=Kibana repository for 8.x packages
baseurl=https://artifacts.elastic.co/packages/8.x/yum
gpgcheck=1
gpgkey=https://artifacts.elastic.co/GPG-KEY-elasticsearch
enabled=1
autorefresh=1
type=rpm-md
EOF
This command sets up a repository your package manager will use to find and install Kibana.
Step #5. Install Kibana
Now, install Kibana using the dnf install kibana command:
sudo dnf install kibanaThis command downloads and installs Kibana from the repository you added. Here is the output:
[root@test ~]# sudo dnf install kibana
Last metadata expiration check: 0:03:41 ago on Tuesday 23 July 2024 07:03:12 AM EDT.
Dependencies resolved.
==============================================================================================================================================================================================================================================
 Package                                                 Architecture                                            Version                                                    Repository                                                   Size
==============================================================================================================================================================================================================================================
Installing:
 kibana                                                  x86_64                                                  8.14.3-1                                                   kibana-8.x                                                  329 M

Transaction Summary
==============================================================================================================================================================================================================================================
Install  1 Package

Total download size: 329 M
Installed size: 971 M
Is this ok [y/N]: y
Downloading Packages:
kibana-8.14.3-x86_64.rpm                                                                                                                                                                                       56 MB/s | 329 MB     00:05
----------------------------------------------------------------------------------------------------------------------------------------------------------------------------------------------------------------------------------------------
Total                                                                                                                                                                                                          56 MB/s | 329 MB     00:05
Running transaction check
Transaction check succeeded.
Running transaction test
Transaction test succeeded.
Running transaction
  Preparing        :                                                                                                                                                                                                                      1/1
  Running scriptlet: kibana-8.14.3-1.x86_64                                                                                                                                                                                               1/1
  Installing       : kibana-8.14.3-1.x86_64                                                                                                                                                                                               1/1
  Running scriptlet: kibana-8.14.3-1.x86_64                                                                                                                                                                                               1/1
Creating kibana group... OK
Creating kibana user... OK

—--
—--

[/usr/lib/tmpfiles.d/elasticsearch.conf:1] Line references path below legacy directory /var/run/, updating /var/run/elasticsearch → /run/elasticsearch; please update the tmpfiles.d/ drop-in file accordingly.

  Verifying        : kibana-8.14.3-1.x86_64                                                                                                                                                                                               1/1

Installed:
  kibana-8.14.3-1.x86_64

Complete!
Step #6. Verify the Kibana installation was successful
Check if Kibana is correctly installed:
rpm -qi kibanaThis command provides details about the Kibana package and confirms it’s installed. Here is the output:
[root@test ~]# rpm -qi kibana
Name        : kibana
Version     : 8.14.3
Release     : 1
Architecture: x86_64
Install Date: Tuesday 23 July 2024 07:07:52 AM EDT
Group       : default
Size        : 1018197441
License     : Elastic License
Signature   : RSA/SHA512, Tuesday 09 July 2024 04:23:22 AM EDT, Key ID d27d666cd88e42b4
Source RPM  : kibana-8.14.3-1.src.rpm
Build Date  : Monday 08 July 2024 08:34:04 PM EDT
Build Host  : bk-agent-prod-gcp-1720483705802699891.c.elastic-ci-prod.internal
Relocations : /
Packager    : Kibana Team <info@elastic.co>
Vendor      : Elasticsearch, Inc.
URL         : https://www.elastic.co
Summary     : Explore and visualize your Elasticsearch data
Description :
Explore and visualize your Elasticsearch data
Step #7. Start and enable the Kibana service
Next, you should start and enable the Kibana service using these instructions.
7.1. Start Kibana and enable it on boot up
Start Kibana and ensure it starts automatically upon booting the system:
sudo systemctl start kibana
sudo systemctl enable kibana
Here is the output:
[root@test ~]# sudo systemctl start kibana
[root@test ~]# sudo systemctl enable kibana
Synchronizing state of kibana.service with SysV service script with /usr/lib/systemd/systemd-sysv-install.
Executing: /usr/lib/systemd/systemd-sysv-install enable kibana
Created symlink /etc/systemd/system/multi-user.target.wants/kibana.service → /etc/systemd/system/kibana.service.
7.2. Check and verify the Kibana service status
Next, check and verify the Kibana service status using the following command:
sudo systemctl status kibanaHere is the output:
[root@test ~]# sudo systemctl status kibana
● kibana.service - Kibana
   Loaded: loaded (/usr/lib/systemd/system/kibana.service; enabled; vendor preset: disabled)
   Active: active (running) since Tue 2024-07-23 07:30:51 EDT; 18s ago
     Docs: https://www.elastic.co
 Main PID: 2026 (node)
    Tasks: 11 (limit: 11206)
   Memory: 429.0M
   CGroup: /system.slice/kibana.service
           └─2026 /usr/share/kibana/bin/../node/bin/node /usr/share/kibana/bin/../src/cli/dist
Step #8. Enable the Kibana service in the firewall
Allow incoming traffic to Kibana’s default port 5601 through the firewall:
sudo firewall-cmd --zone=public --add-port=5601/tcp --permanent
sudo firewall-cmd --reload
This command opens the necessary port and reloads the firewall settings to apply the changes.
Step #9. Configure Kibana
In this section is the guidance for configuring the Kibana service.
9.1. Open the Kibana configuration file
Use nano or another tool to open the Kibana configuration file in a text editor:
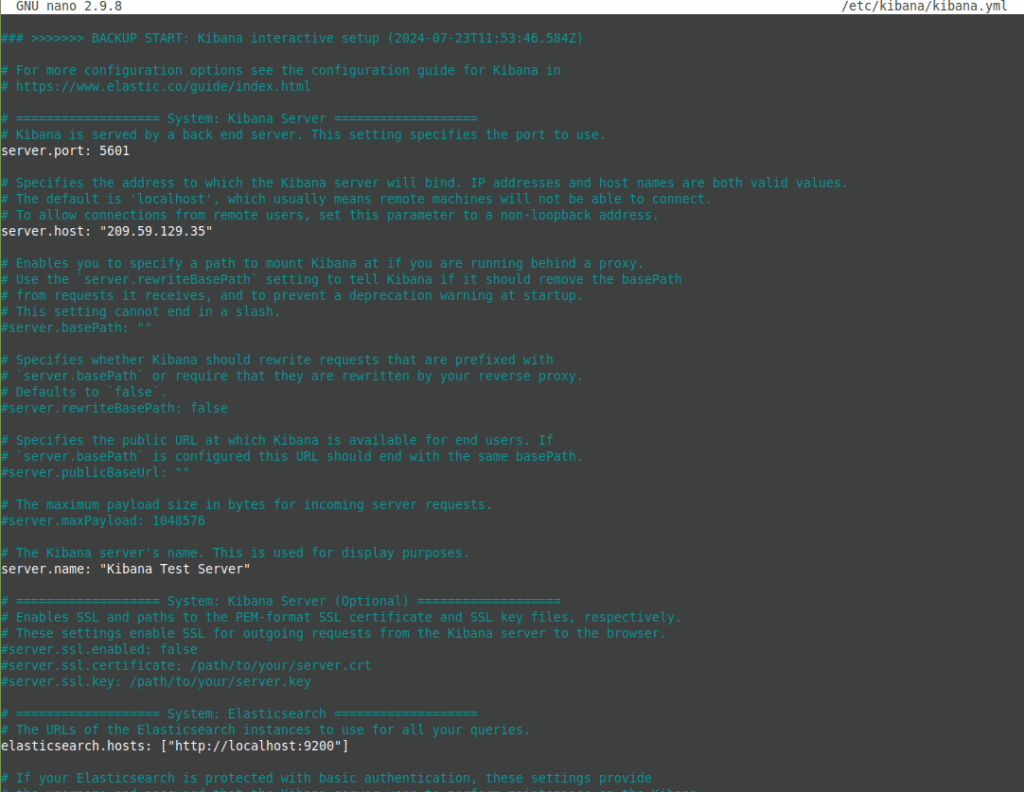
sudo nano /etc/kibana/kibana.yml9.2. Uncomment and configure options as needed
Uncomment and configure the following options as per your requirements:
server.port
server.host
server.name
elasticsearch.hosts
Here is the output:
9.3. Restart the Kibana service
The, restart the Kibana service to reflect the changes using the following systemctl restart kibana command:
sudo systemctl restart kibanaStep #10. Access the Kibana dashboard
Now, let’s navigate to the Kibana dashboard.
10.1. Open your web browser
You can open your web browser and go to the IP address of your server and port 5601:
http://your-server-ip:5601Replace the your-server-ip placeholder shown above with your Liquid Web server’s IP address. For example, it may look like http://123.123.123.123:5601/.
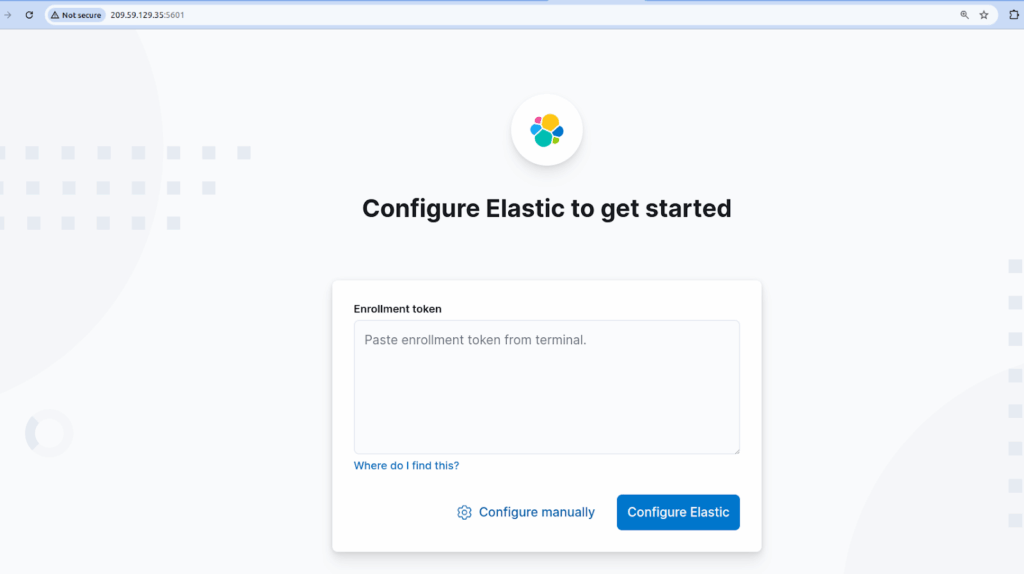
10.2. Getting started with the Kibana interface
The URL in the previous step will take you to the Kibana interface, where you can configure Elastic to get started. Here is the output:
Step #11. Generate an enrollment token for Kibana
At this point in the process, you will need to generate an enrollment token.
11.1. Generate an enrollment token
We can generate an enrollment token using the Elasticsearch tool:
/usr/share/elasticsearch/bin/elasticsearch-create-enrollment-token -s kibanaThis command generates an enrollment token that will be used later during the setup process. Here is the output:
[root@test ~]# /usr/share/elasticsearch/bin/elasticsearch-create-enrollment-token -s kibana
eyJ2ZXIiOiI4LjE0LjAiLCJhZHIiOlsiMjA5LjU5LjEyOS4zNTo5MjAwIl0sImZnciI6ImVlNDQxZmFjOTJlZDM1NTg1NWJhMTA5YTJlMWUyNjViMWE3MmFkYjQ1OWU4MWQ1NjkzMWQ1MzUwNGFhY2I4ZGEiLCJrZXkiOiJFX3hyMzVBQlhiSFE4M0xqMXlydzoteVYxb2JfNlFQLWVYWm1ab0pwZXRBIn0=
[root@test ~]#
11.2. Copy and paste the enrollment token
Next, copy the enrollment token, paste it into the field, and click the Configure Elastic button:
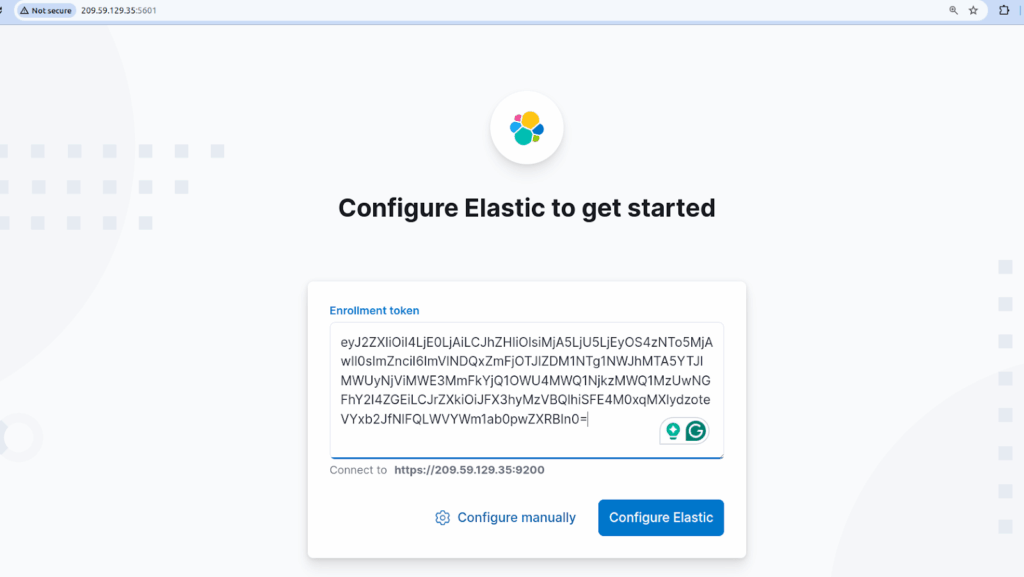
11.3. Complete Elastic setup
Once you click the Configure Elastic button, you will be directed to a page where you must complete the Elastic setup and configuration process. If you prefer, you can also proceed with the manual configuration steps:
Step #12. Generate a verification code for Kibana
This section documents the steps for generating a verification code for Kibana.
12.1. Generate a verification code specific to Kibana
Here is what the syntax will like when you generate a verification code specific to Kibana:
sudo /usr/share/kibana/bin/kibana-verification-codeHere is the output:
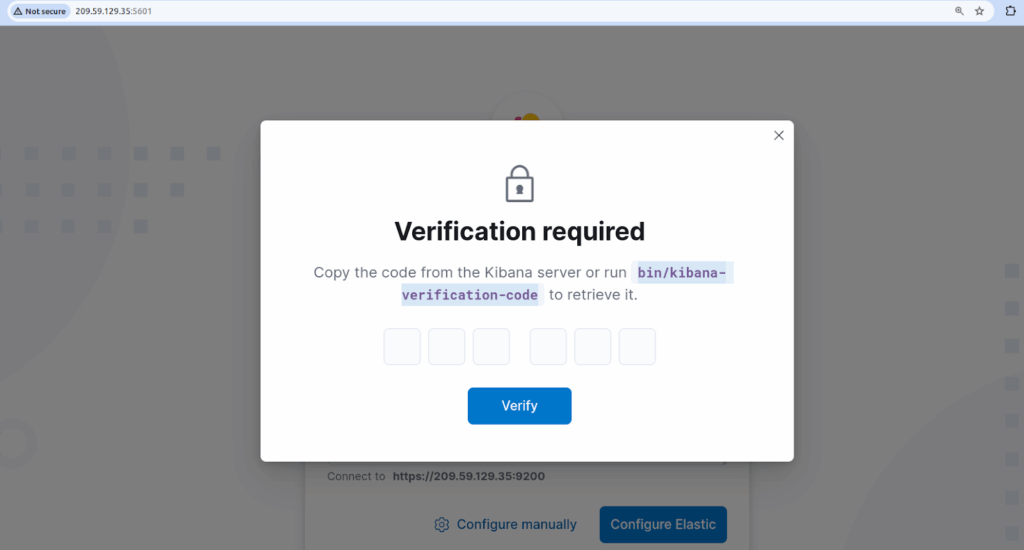
[root@test kibana]# sudo bin/kibana-verification-code
Your verification code is: 753 287
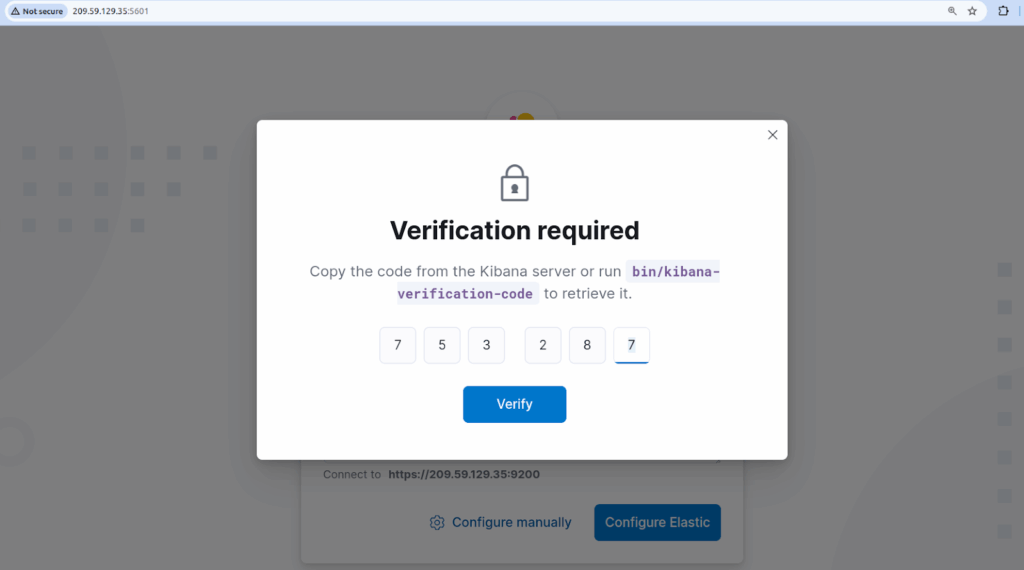
[root@test kibana]# 12.2. Enter the verification code
Type in your verification code in the number fields provided and click the Verify button to start the setup process:
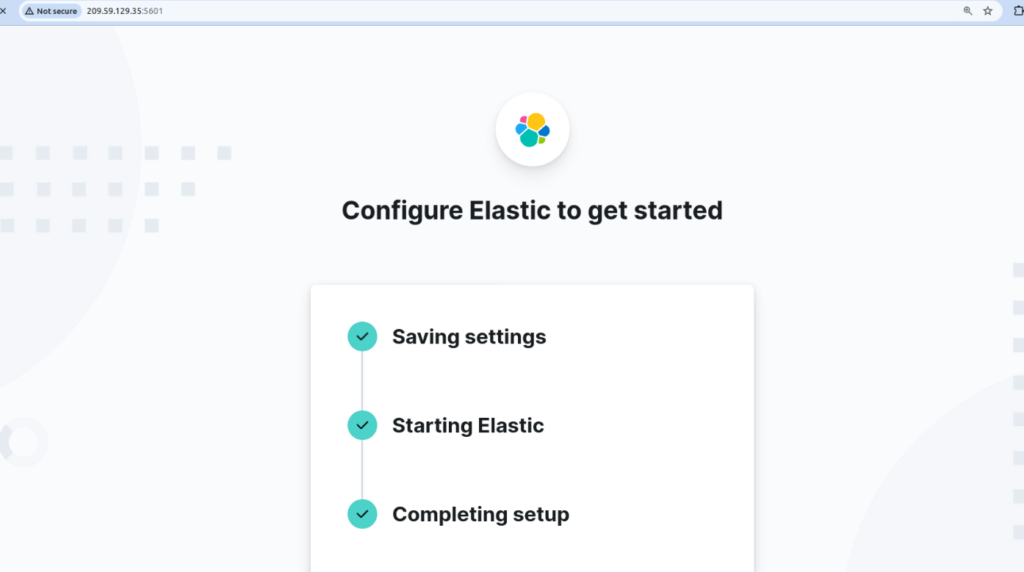
Then, you will be redirected to the Elastic configuration setup page:
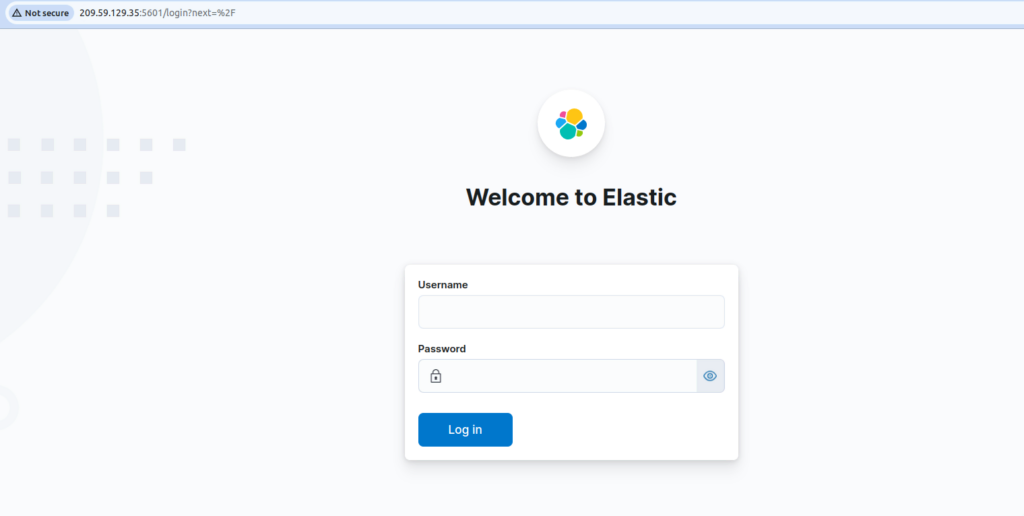
Once the Elastic configuration process is complete, you will be redirected to the Kibana dashboard’s login page:
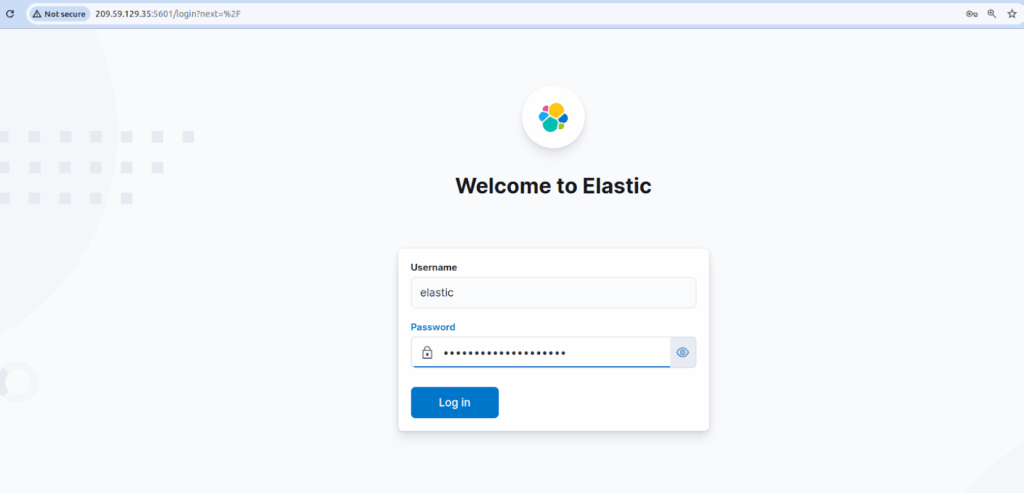
12.3. Locate and enter your Elasticsearch login details
The login details are in the Security Autoconfiguration Information section during the Elasticsearch package installation. For more details, refer to the article How to Install Elasticsearch on Linux (AlmaLinux).
Enter your Elasticsearch username with the corresponding password and click the Log In button to go to the Kibana dashboard:
12.4. Explore the Kibana dashboard
The Kibana dashboard’s homepage looks like the one shown below:
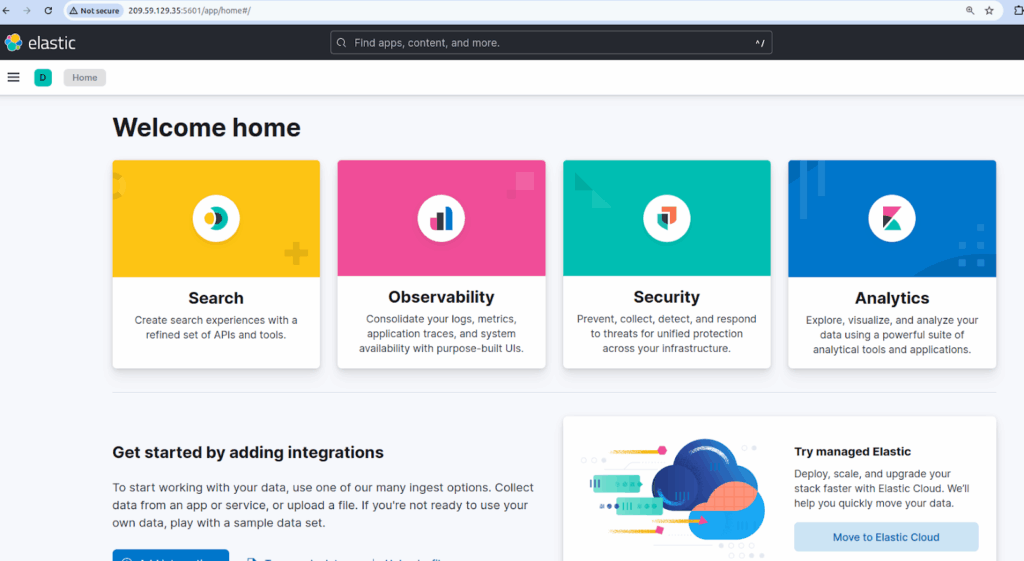
How to use Kibana
Once Kibana is set up, here’s how to get started.
1. Explore your data in greater detail
Go to the Discover section to search through and explore your data.
2. Create visualizations
The Visualize section builds charts and graphs.
3. Build dashboards
Use the Dashboard section to combine your visualizations into dashboards to get a comprehensive view of your data.
How to update Kibana
To update Kibana, issue the dnf upgrade kibana command:
sudo dnf upgrade kibanaThis command specifically upgrades Kibana to the latest version available in the repository.
How to uninstall Kibana
To uninstall Kibana, follow the steps here in this section.
1. Stop the Kibana service
The systemctl stop kibana command will stop the service:
sudo systemctl stop kibanaThis command stops the Kibana service so it can be safely removed.
2. Disable the Kibana service
Here is the corresponding command:
sudo systemctl disable kibanaIssuing his command prevents Kibana from starting automatically in the future.
3. Remove Kibana
To remove the Kibana software run this command:
sudo dnf remove kibanaThis command deletes the Kibana package from your Liquid Web server.
4. Remove the Kibana repository file (optional)
Here is the command to remove the repository file:
sudo rm /etc/yum.repos.d/kibana.repoThis step is optional but removes the Kibana repository file if you no longer need it.
Unlock the power of Kibana with Liquid Web hosting
Installing Kibana on AlmaLinux provides a robust and scalable solution for your data visualization needs. AlmaLinux, with its stability and community support, ensures a reliable environment for running Kibana. By choosing this combination, you can leverage the power of Kibana’s advanced analytics and visualization tools on a secure and performant operating system. Contact our hosting professionals for next steps if you get stuck with any portion the Kibana setup instructions covered above.
To seamlessly install Kibana and ensure optimal performance, ordering a hosting plan from Liquid Web is an excellent choice. We offer reliable, high-performance hosting solutions for running Kibana on AlmaLinux. Our managed hosting plans include robust support and features designed to suit the needs of modern applications, making the setup process simple and hassle-free.
Don’t wait to enhance your data analytics capabilities — order your hosting plan from Liquid Web today running on AlmaLinux. Then, you and your team can realize the many benefits that come with installing Kibana on your cloud hosting, dedicated hosting, and VPS hosting Linux-based system.