Monitoring Your Server with htop
Keeping an eye on your server’s performance is crucial for maintaining stability and quickly troubleshooting issues. While top is a well-known tool, htop offers a more user-friendly and powerful way to monitor your system and processes. Think of htop as an enhanced version of top, providing a clearer, more interactive view of what’s happening on your server.
Why htop?
htop makes system monitoring easier by:
- Presenting information in a more readable, colorful layout.
- Allowing you to scroll through and sort the process list.
- Enabling you to send signals (like
kill) to processes directly from the interface. - Showing you precisely how much physical memory applications are using, excluding buffer and cache memory.
Installing htop (YUM)
If htop isn’t already on your server, you can usually install it from the EPEL (Extra Packages for Enterprise Linux) repository.
- Install EPEL Release (if needed):
yum -y install epel-release- Install htop:
yum -y install htopIf you encounter an error like “No package htop available,” check your /etc/yum.repos.d/epel.repo file to ensure the EPEL repository is enabled.
- If you installed EPEL just for
htopand don’t need it for other software, it’s generally safe to remove theepel-releasepackage afterhtopis installed:
yum remove epel-releaseHow to use htop?
Once htop is running (just type htop in your terminal and press Enter), you’ll see a dynamic, real-time display of your server’s activity.
CPU and memory usage :
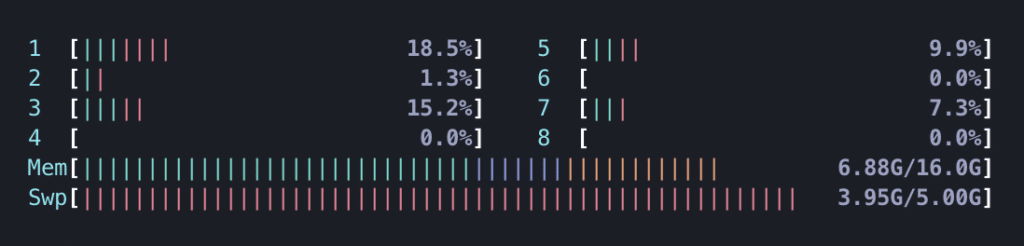
At the top of the htop display, you’ll see multiple numbered bars with colorful segments.
- CPU Cores: Each bar represents a CPU core on your server. The number of bars corresponds to the number of cores your CPU has. The colors within each bar indicate the type of load:
- Blue: Low-priority processes.
- Green: Normal user processes (applications you run).
- Red: Kernel processes (core operating system tasks).
- Memory (Mem) and Swap (Swp): Below the CPU bars, these rows show your server’s memory usage. The colors within these bars represent:
- Green: Memory actively used by running programs.
- Blue: Memory used for buffers (temporary storage for disk I/O).
- Yellow: Memory used for cache (recently accessed data from disk, speeding up future access).
Tasks, system load averages, and uptime
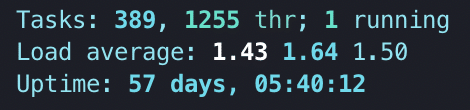
Next to the memory bars, you’ll find key system statistics:
- Tasks: This shows the number of active processes on your system. It typically displays three values: the total number of processes, the number of threads within those processes, and how many tasks are currently running.
- Load Average: This measures the computational work your CPU is handling. It’s a key indicator of how busy your server is.
- A single-core CPU at 100% utilization would have a 1.0 load average.
- A quad-core CPU at 100% utilization would have a 4.0 load average.
- You’ll see three numbers: the average load over the last one minute, five minutes, and fifteen minutes.
- Uptime: This tells you how long your system has been running continuously since its last reboot.
Process information
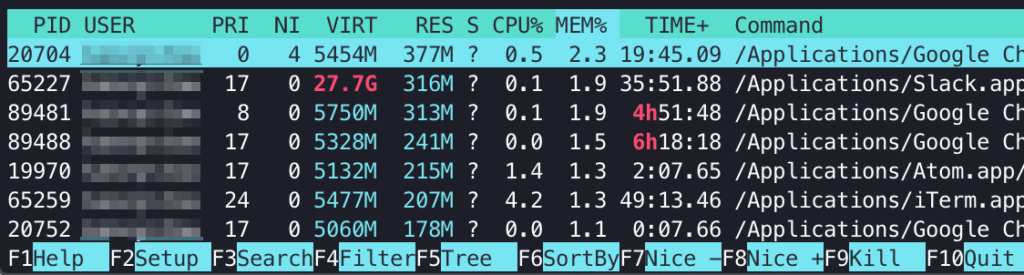
The main part of the htop screen is a list of all running processes. Each column provides specific details:
- PID: The unique Process ID number.
- USER: The user account that owns the process.
- PRI: The process’s priority as set by the kernel.
- NI: The “nice” value, which is the process priority adjusted by a user or root.
- VIRT: The total virtual memory the process is using.
- RES: The actual physical memory (RAM) the process is consuming.
- SHR: The amount of shared memory the process is using.
- S: The current state of the process (e.g.,
Rfor running,Sfor sleeping). - CPU%: The percentage of CPU resources the process is currently using.
- MEM%: The percentage of total physical memory the process is consuming.
- TIME+: The total CPU time the process has used since it started.
- Command: The name of the command or program that started the process.
Footer menu commands
At the bottom of the htop screen, you’ll see a row of function key commands (F1 through F10) that provide quick access to common actions:
- F2 Setup: Tweak
htop‘s display options, columns, and colors. - F3 Search: Find specific processes by name.
- F4 Filter: Apply filters to narrow down the displayed processes.
- F5 Tree: View processes in a hierarchical tree structure, showing parent-child relationships.
- F6 SortBy: Change the sorting order of processes (e.g., by CPU usage, memory usage).
- F9 Kill: Send a signal to the currently highlighted process (e.g., to stop it).
- F10 Quit: Exit
htop.
Useful shortcut keys
To become even more efficient with htop, try these keyboard shortcuts:
- u: Display all processes owned by a particular user (you’ll be prompted to select a user).
- p: Sort processes by high CPU consumption.
- m: Sort processes by high memory consumption.
- t: Sort processes by the total time they’ve been running.
- Space: “Tag” a process. You can tag multiple processes and then perform actions on all tagged processes at once.
- c: Tag a process and all its child processes.
- Shift + u: Remove all tags.
- Shift + f: Highlight and “follow” a process. If the process moves in the list due to sorting,
htopwill keep it in view. - Shift + h: Toggle showing/hiding user and kernel processes.
- a: Set what CPU cores a process can access (affinity).
- i: Set a process’s I/O priority.
- h: Display the
htophelp menu.
Conclusion
htop is an indispensable tool for anyone managing a Linux server. Its intuitive interface and powerful features make it easy to monitor performance, identify resource-intensive processes, and troubleshoot issues quickly. By familiarizing yourself with htop, you’ll gain a deeper understanding and better control over your server’s health. As always, if you have questions or need assistance, contact our Support team.