New Relic monitoring of WordPress and database performance
Overview
Our Managed WordPress and Managed WooCommerce Control Panel now has integrated support for the New Relic monitoring solution, which is officially called Application Performance Monitoring (APM) by New Relic.
New Relic helps store owners find performance bottlenecks. You can find out which database queries are the slowest and which plugins or hooks are the most time consuming.
Nexcess does not provide New Relic accounts. You will need to sign up and create your own account at New Relic.
Step by step instructions
- Log in to your account at New Relic and retrieve your license key.
- Log in to my.nexcess.net. for Managed WordPress and Managed WooCommerce.
- In the portal, find the site you want to monitor using New Relic.
- Next, click the Show More button at the bottom of the sidebar, and then you will be able to access the Integration tab.
- Once you are in the Integrations tab, scroll down to the Performance Monitoring section.
- Click the Enable button, which will open a popup.
- Add the New Relic license key in the popup window and click the Enable button again to save it.
- To send data from your site to New Relic, you must install and activate a New Relic integration plugin (New Relic Reporting for WordPress plugin) from wp-admin on your site.
- From the Add Plugins screen in wp-admin, search for “new relic” and then you will need to install and activate the New Relic Reporting for WordPress plugin on your site.
wp plugin install wp-newrelic --activate- Now when you are logged into your New Relic account for the application of the site you will notice a WordPress section which includes two sections one for hooks and another for plugins and themes.
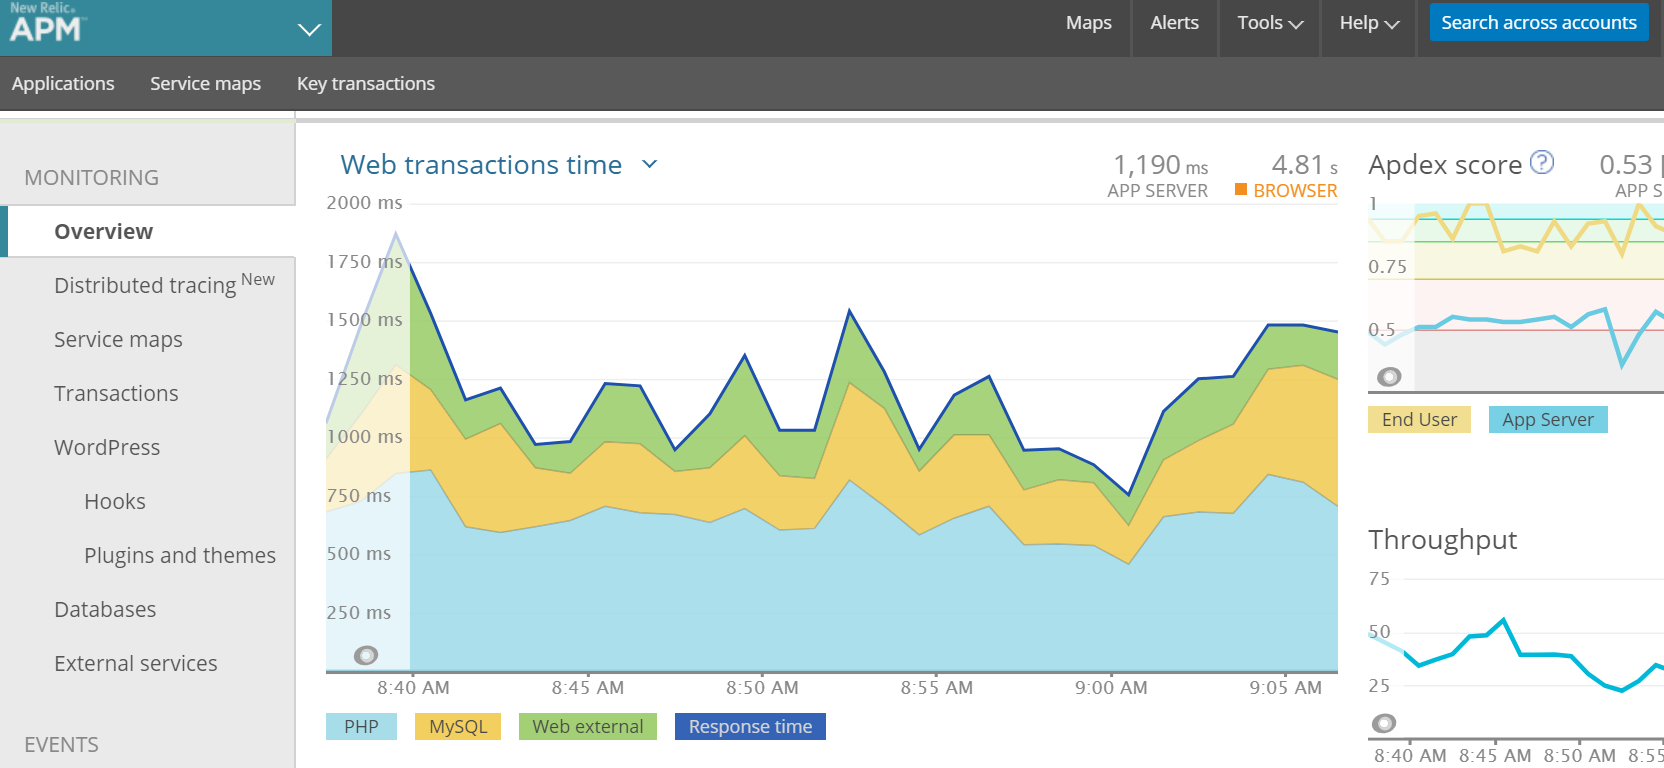
Overview section
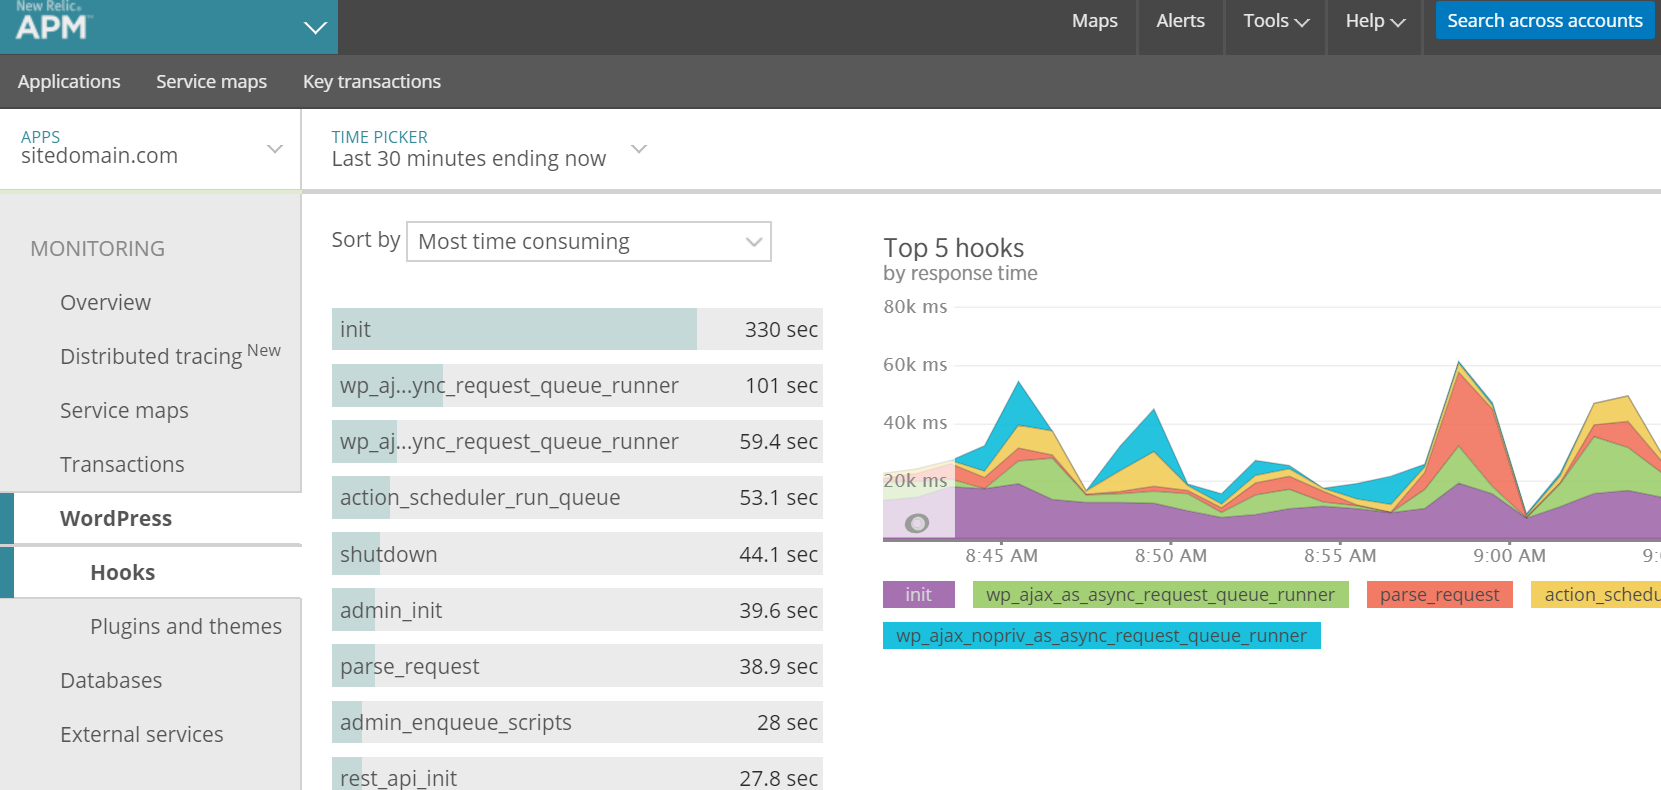
Hooks section
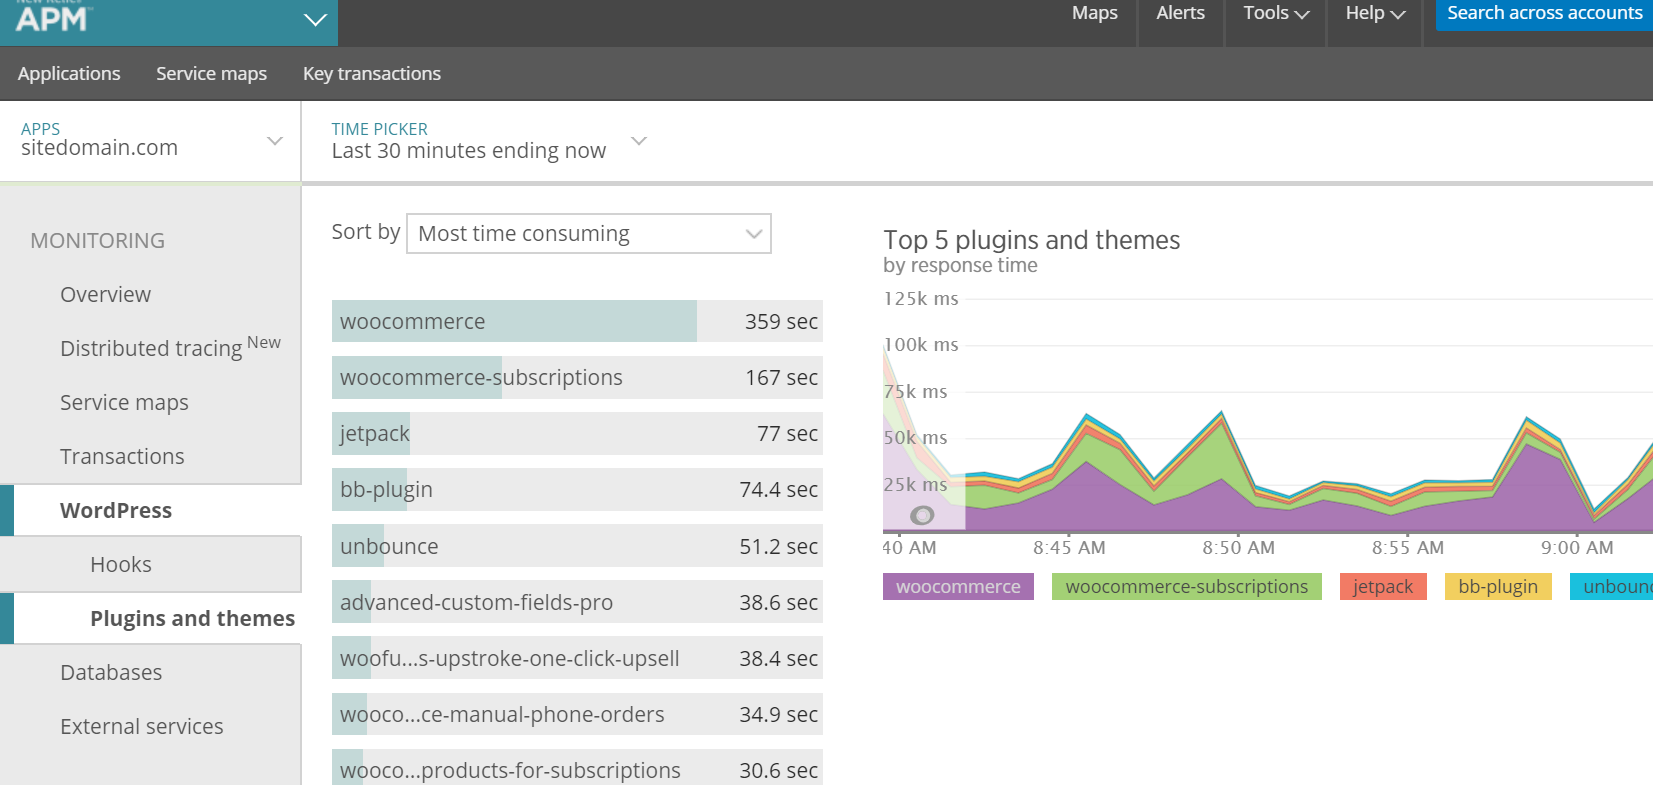
Plugins and themes section
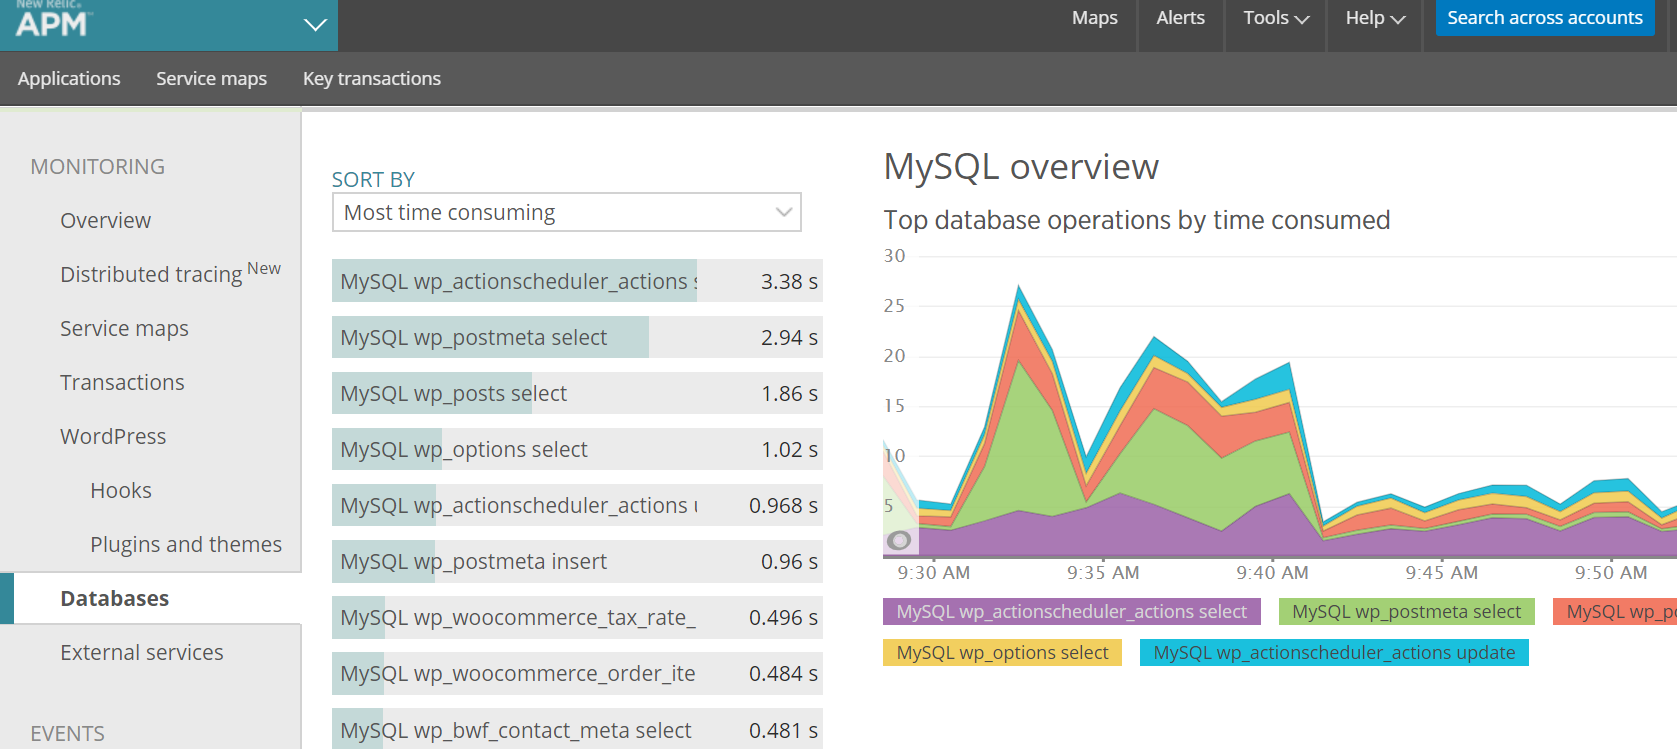
Databases section
New Relic will allow you to find slow database queries and slow hooks as well as finding out which plugins or what functionality in your theme might be causing performance issues.
You can also use the database tab to find out which queries are the most time consuming or have the slowest query time: