Website statistics with SiteWorx
Launching the AWStats panel from SiteWorx
- Login to SiteWorx.
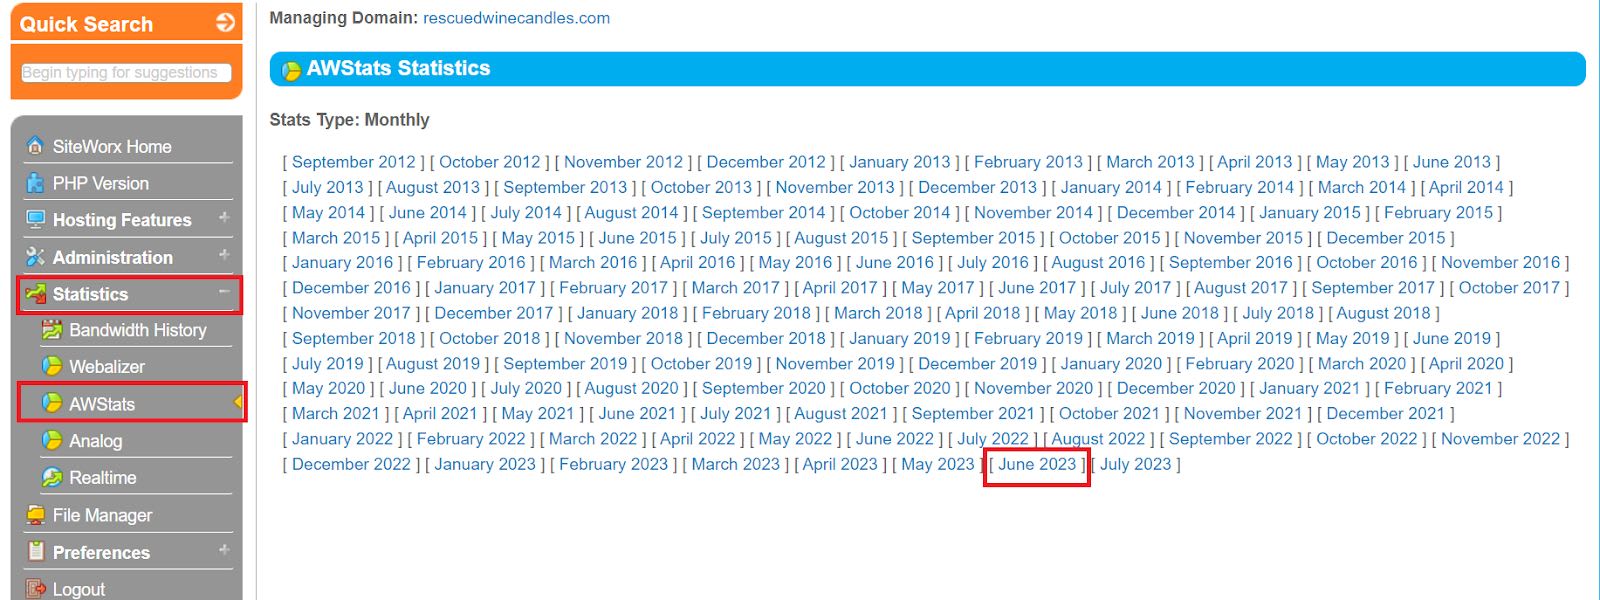
- Once you are logged in, be sure to navigate to the AWStats Statistics area in the user interface and identify the month for which you want to see website statistics:

Understanding and reading AWStats logs
Once the AWStats feature is launched at the top of the page, you will see general information, the name of the site you are looking into, the last date it was updated, and the month for the listed traffic:

In the middle section are referral links, meaning that if you want a quick way to see data related to robots and spiders visiting and crawling your site, you can click the Robots/Spiders link — and the page will be directed there.
Nexcess clients can use the various statistics features in SiteWorx for hosting to view bandwidth data for their site’s inbound and outbound traffic — among other data points. In the Summary section, you will see various site statistics broken down by:
- Unique visitors. This value is the number of different visitors that have accessed your site.
- Number of visits. The sum of visits from all the unique visitors that have visited your site.
- Pages. Number of pages that have been visited.
- Hits. This section displays the total number of hits on your site for images, pages, files, etc.
- Bandwidth. Displays the quantity of data that was transmitted, serving all the website requests.
The next section of the AWStats module will show more detailed information about the traffic. For example, the monthly history displays the traffic for each month of the year.
The Days of Month section displays traffic by day for the selected month. This data can be used to pinpoint the day of the traffic surges (if there are any) or days when the traffic started falling off, which would then give you more information about the performance of your website. Based on the data reported, you may decide to search through the logs manually for deeper analysis:

After Days of Month, the following two most important sections would be the user interface’s Hosts and Robots/Spiders Visitors data boxes. Information found here can extensively help if your site is loading slowly, having timeout issues, or not loading at all.
In the Hosts section, you will find “Top 10” IP addresses hitting your site. As you can imagine, if there is an IP or multiple IPs that have a lot of hits, we can assume that they are either malicious or caused by a misconfiguration of the site.
In the Robots/Spiders Visitors section, we can see the signature of bots crawling the site and the number of hits on your site. This information can also be used to pinpoint if bad bots are targeting your site. Both IPs and bad bots can be blocked through proper configuration of the .htaccess file.
If you block an IP your site is actively using, there is always a chance of breaking the site. Also, not all bots are bad. Some bots make your site appear on Google searches with higher priority, so blocking them would hurt your Search Engine Optimization (SEO).
Another essential section would be the HTTP status codes, which are server responses to incoming page requests. Naturally, if there are a lot of 404 or 500 status codes, it means that someone or something is trying to access files or pages which are not accessible, not viewable, or they don’t exist. These HTTP status codes can also be used to analyze the performance of your website.
More about the features of AWStats — a potent analytics tool
AWStats is a robust analytics tool that — when used correctly — can provide detailed insight into your site’s performance and can even prevent the site from going down if monitored proactively. In addition to the functionality described in the previously mentioned sections, AWStats can also be used to check the time visitors spend on your site, which files were downloaded the most, which pages have the most visits, and even the browsers your visitors used.
There is plenty more to learn more about the AWStats functionality. We recommend reading the Viewing AWStats for managed WordPress and WooCommerce article as well checking out the following resources:
Conclusion
AWStats is a powerful analytics tool, that when used properly, can provide detailed insight of your site’s performance — and can even prevent the site going down if monitored properly.

