Key points
- Successful microservices management relies on comprehensive monitoring to track dependencies, detect issues early, and optimize performance.
- Addressing challenges like diverse services, integration complexities, and distributed tracing with advanced tools and strategies ensures a stable microservices environment.
- Integrated monitoring improves fault isolation, accelerates problem resolution, and enhances performance optimization through AI-powered insights and seamless DevOps integration.
- The future of microservices monitoring includes AI and machine learning for predictive analytics, the rise of serverless and cloud-native technologies, and a focus on security and compliance.
- Liquid Web’s managed dedicated servers provide the flexibility, control, and expert support needed to tailor monitoring solutions for optimal microservices performance and reliability.
The rise of microservices has fundamentally transformed how applications are developed, allowing for more agile, scalable, and resilient software solutions. However, with these benefits come new challenges, especially in monitoring and managing these distributed systems. As applications break down into numerous, interconnected services, keeping track of everything becomes a complex puzzle.
In a traditional monolithic application, monitoring is relatively straightforward. Issues are often easier to identify and debug since all components are tightly coupled in one codebase. However, in a microservices architecture, services are interdependent. Pinpointing the root cause is tougher because an issue may originate in the complex web of service interactions rather than a single component.
Performance bottlenecks are also a common issue. As the number of microservices grows, identifying which service is causing slowdowns can be like finding a needle in a haystack. Ensuring smooth integration with other tools and platforms further complicates monitoring.
Don’t worry, though. By the end of this article, you’ll be equipped with the knowledge and tools to effectively monitor and manage your microservices, helping you maintain a high-performing application environment.
Unlocking the potential of microservices with effective monitoring
Due to their inherent complexity, microservices require comprehensive monitoring to manage dependencies, detect issues early, and optimize performance. Unlike traditional monolithic applications, where all components are housed together, microservices are distributed across multiple services, each with its own responsibilities and interdependencies. This distributed nature makes it challenging to maintain visibility and control over the entire system without strong monitoring practices.
Monitoring microservices effectively offers several significant benefits:
- Improved system reliability and uptime: Continuous monitoring ensures that services are running smoothly and any potential issues are identified before they escalate, thereby enhancing system reliability and uptime.
- Enhanced performance through proactive issue detection and resolution: By detecting performance issues early, monitoring allows for proactive resolutions, ensuring that services remain performant and user experience is not compromised.
- Better resource allocation and cost management: Monitoring resource utilization helps in optimizing the allocation of resources, preventing over-provisioning or under-utilization, and thereby managing costs effectively.
Key metrics to track for optimal performance
Response time
This measures the duration between when a request is sent to a service and when the response is received, including the time it takes for database queries, computations, and any other operations required to fulfill the request.
High response times can indicate performance bottlenecks. That’s why monitoring and optimizing response times (by implementing caching and load balancing, for example) is important to ensure fast and efficient service delivery.
Error rates
Error rates track the frequency of errors that occur within a service due to a variety of reasons, such as exceptions in the code, failed database connections, or invalid inputs. Monitoring error rates helps in identifying recurring issues (like bugs in the code or infrastructure) that could affect service stability.
Implement error tracking and alerting to quickly identify and resolve issues. Regularly review error logs and conduct root cause analysis.
Resource utilization
Resource utilization measures the usage of critical system resources like CPU, memory, and disk space. High CPU usage might indicate intensive computations, while high memory usage could suggest memory leaks or inefficient data handling. Disk utilization helps in understanding storage needs and performance.
You can use resource utilization data to optimize and scale resources as needed based on usage patterns.
Throughput
Throughput refers to the amount of work a service performs in a given time frame, often measured in transactions per second or requests per minute. It indicates how many operations the service can handle and is a critical measure of the system’s capacity and performance under load.
Monitoring throughput ensures services can handle the expected load and uncovers if there are code or database queries that need to be optimized.
Latency
Latency measures the delay before a transfer of data begins following an instruction. It includes the time taken for data to travel across the network and the time taken by the service to process the data.
High latency can degrade user experience significantly and indicate network or processing delays. Tracking and minimizing latency (by using content delivery networks and optimizing network paths) is vital for improving service responsiveness.
Availability
Availability is the percentage of time a service is operational and accessible to users. It is calculated as the total uptime of the service divided by the total time period considered.
High availability is crucial for maintaining user trust and satisfaction. You can implement redundancy and failover mechanisms to maintain high availability, and conduct regular failover testing to ensure reliability.
Resiliency
Resiliency refers to a service’s ability to recover quickly from failures and continue operating. It involves designing services that can handle unexpected issues without significant downtime, using strategies such as redundancy, failover mechanisms, and self-healing processes.
Design services with resiliency in mind, using techniques like circuit breakers and retries. Implement automated recovery processes.
The top challenges in microservices monitoring (+ solutions)
Diversity of services and programming languages
Microservices architectures often involve a mix of different programming languages and technologies, which can make it challenging to implement a unified monitoring solution. Each microservice may be built using different languages such as Java, Python, Go, or Node.js, requiring a versatile approach to monitoring.
To address this diversity, it’s essential to use monitoring tools that support multiple languages and frameworks, allowing for a consistent view across all services despite their differences.
Tools like Datadog and Prometheus are excellent choices because they integrate smoothly with various languages and frameworks, offering robust monitoring capabilities regardless of the underlying technology. Also, leading hosting solutions (like Liquid Web’s services) are designed to support diverse tech stacks, ensuring integration and monitoring for your microservices, no matter the languages or frameworks in use.
Integrating with various platforms and libraries
Integrating monitoring tools with the various platforms, libraries, and third-party services used in a microservices architecture adds another layer of complexity. Effective integration requires comprehensive documentation and standardized APIs to ensure smooth communication and data collection.
Service meshes like Istio and Linkerd simplify these integrations. They provide a uniform layer for communication and monitoring, abstracting the complexities of individual service interactions.
Implementing distributed tracing
Understanding the flow of requests across multiple microservices is essential for effective monitoring, and this is where distributed tracing comes in. However, implementing distributed tracing can be challenging due to performance overhead and complex configurations.
Tools like Jaeger, Zipkin, and OpenTelemetry are designed to handle distributed tracing effectively, providing deep insights into request flows and dependencies among services. These tools help identify bottlenecks and performance issues, ensuring smooth operations.
Additionally, follow best practices for setting up and optimizing distributed tracing to minimize performance impact. This includes careful configuration and regular performance reviews to ensure the tracing system itself does not become a bottleneck.
Managing the complexity of shared, dynamic services
In a microservices architecture, it’s important to maintain continuous, accurate documentation and a clear understanding of how each component interacts with others. Without this, managing dependencies and diagnosing issues becomes nearly impossible.
Having clear ownership and responsibility for each microservice is also essential. This ensures that any issues can be quickly addressed by the right team or individual. Make sure to implement a robust documentation strategy and use tools that provide real-time insights into service dependencies and interactions. This approach helps maintain clarity and order in a complex, dynamic environment.
Incorporating monitoring into CI/CD pipelines
Integrating monitoring into the CI/CD pipeline is necessary for maintaining continuous performance and reliability. However, automating the setup and configuration of monitoring as part of the deployment process can be challenging.
To overcome this, automation is key to ensure that monitoring setups are maintained accurately across all deployments. Use scripts and automation tools to integrate monitoring easily into your CI/CD workflows. This ensures that monitoring configurations are consistently applied and updated with each deployment.
Evaluating industry-leading microservices monitoring tools
Splunk
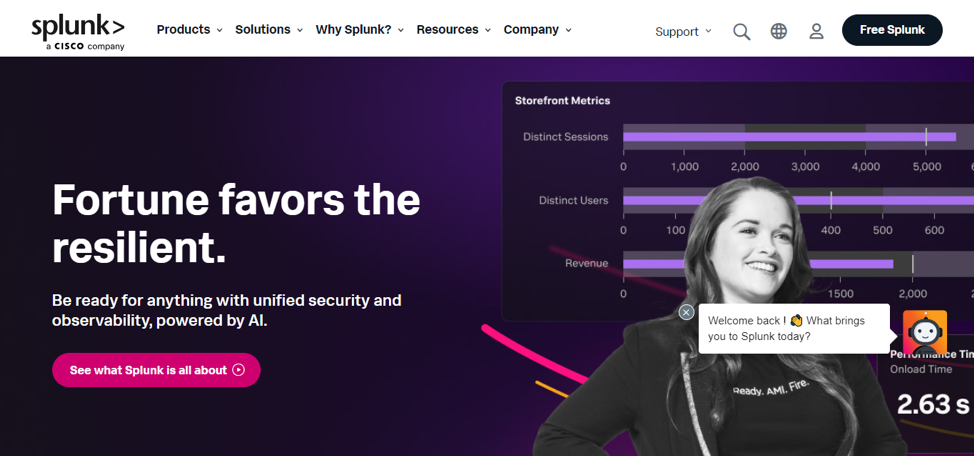
Splunk is renowned for its capabilities in handling diverse machine data, making it a top choice for centralized logging and monitoring in microservices environments. Its key features include:
- Centralized logging and monitoring: Collects and analyzes diverse machine data at scale, providing a unified view of system performance.
- Real-time visibility and alerting: Monitors health and performance metrics, generating real-time alerts for issues to ensure quick resolution.
- Distributed tracing: Traces transactions across services, identifying bottlenecks and improving performance.
- AI/ML anomaly detection: Uses AI to detect anomalies and unusual behaviors, proactively addressing potential issues.
- Enabling observability: Provides deep insights into service performance and dependencies, enhancing overall system observability.
Instana
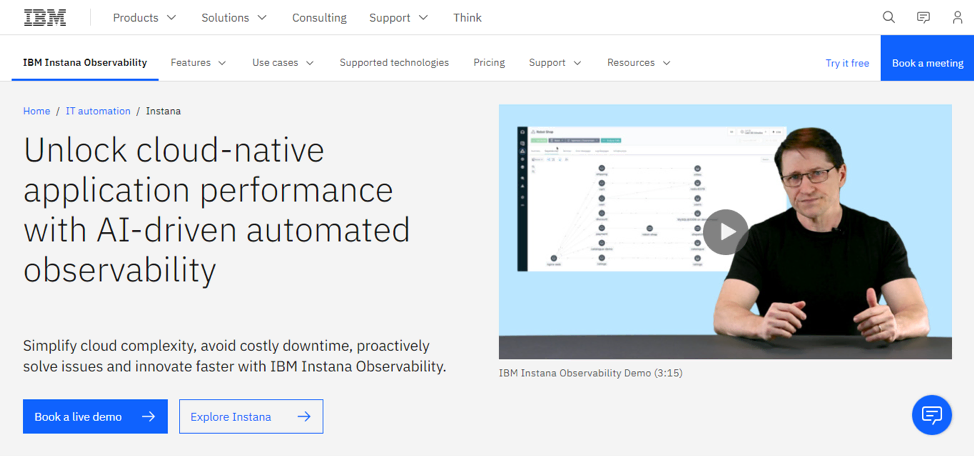
Instana excels in real-time monitoring, offering comprehensive visibility into microservices environments with minimal setup required by providing:
- Automated discovery and mapping: Maps all microservices components and dependencies in real-time, ensuring up-to-date system topology.
- Comprehensive real-time monitoring: Collects metrics, traces, and events with 1-second granularity, providing detailed performance insights.
- Distributed tracing: Offers end-to-end tracing with code-level detail, facilitating precise problem identification.
- AI-powered analytics and alerting: Utilizes AI to detect anomalies and perform root cause analysis, streamlining issue resolution.
- Ease of use: Designed for minimal setup and features an intuitive interface, making it user-friendly.
Dynatrace
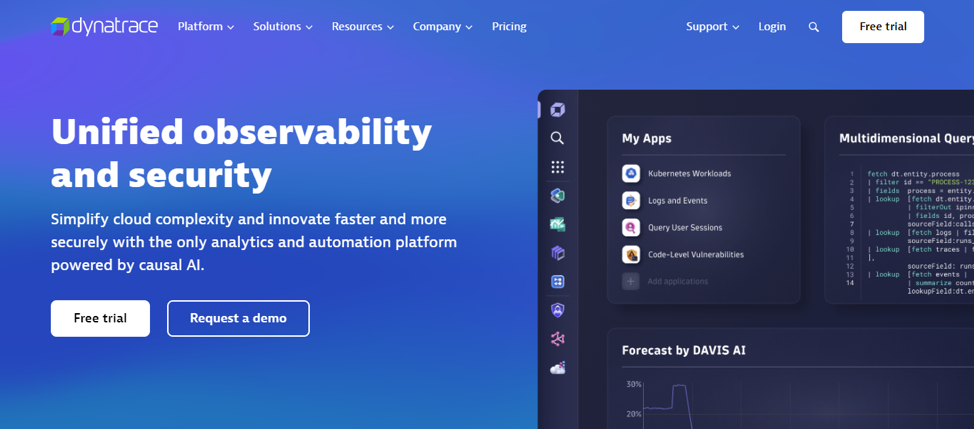
Dynatrace stands out for its advanced AI-powered capabilities and seamless integration with DevOps workflows, making it ideal for dynamic environments. Among its features are:
- End-to-end distributed tracing: Offers complete visibility across the application, from user interactions to backend processes.
- Automatic discovery and mapping: Provides real-time visibility into dynamic environments with continuous topology updates.
- AI-powered root cause analysis: Davis AI quickly identifies root causes, reducing Mean Time To Resolution (MTTR).
- Container and Kubernetes monitoring: Supports containerized applications out-of-the-box, making it ideal for modern infrastructures.
- Real-time updates and performance optimization: Continuously updates system topology and optimizes performance in real-time.
- DevOps integration: Integrates with CI/CD pipelines for continuous observability and monitoring.
Grafana
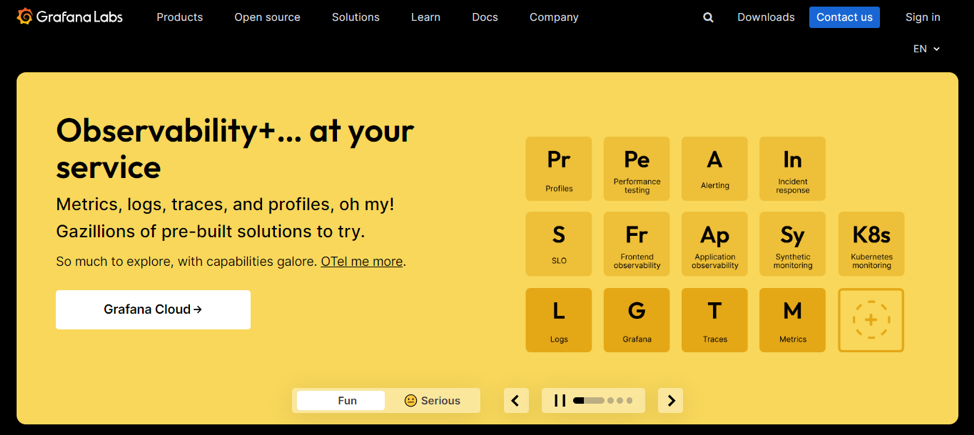
Grafana is a powerful open-source tool known for its visualization and dashboarding capabilities, providing a flexible solution for monitoring diverse data sources with features like:
- Visualization and dashboarding: Creates customizable dashboards for metrics, logs, and traces, enhancing data visualization.
- Data source integration: Supports various data sources like Prometheus and Loki, offering versatile data integration.
- Alerting and scalability: Robust alerting capabilities designed for large-scale deployments, ensuring reliable monitoring.
- Open source and extensible: Supported by a large community and offers plugins, allowing for extensive customization.
- Cloud and on-premises options: Flexible deployment options to suit different organizational needs.
Honeycomb

Honeycomb offers comprehensive observability with a focus on capturing and analyzing high-cardinality data, making it ideal for deep insights and real-time debugging. Some of the key features of this tool are:
- Comprehensive observability: Captures and analyzes high-cardinality data, providing deep insights into system performance.
- Fast query and analysis: Detects patterns quickly for real-time debugging and performance tuning.
- Unified data analysis: Combines logs, metrics, and traces in a single view, simplifying troubleshooting.
- Distributed tracing: Provides integrated tracing for end-to-end user experiences, improving visibility.
- High-cardinality data support: Tracks many unique identifiers and attributes, enhancing observability.
- OpenTelemetry support: Fully supports OpenTelemetry for flexible instrumentation and data collection.
Lightstep (now Cloud Observability)
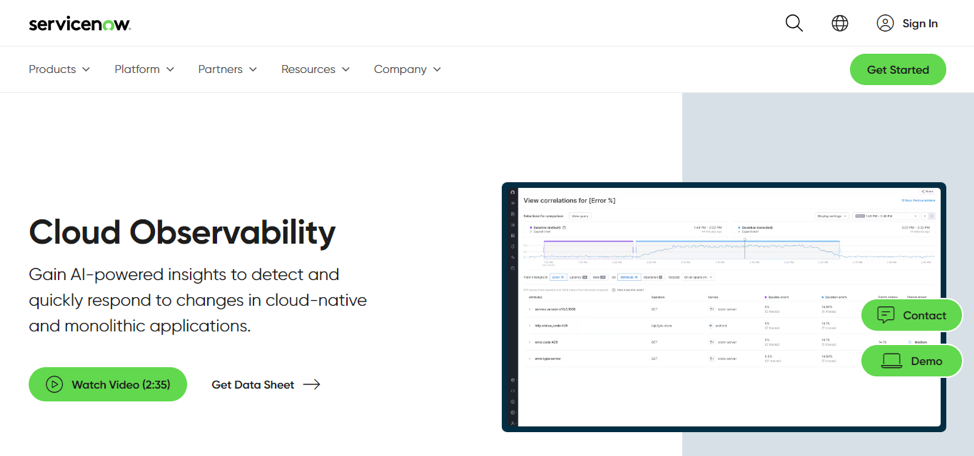
Cloud Observability is designed to manage the complexity of microservices architectures, offering advanced features for performance optimization and rapid troubleshooting. Its main features include:
- Complexity management: Helps understand and manage complex microservices architectures, ensuring clear visibility.
- Performance optimization: Identifies and resolves performance bottlenecks, enhancing system efficiency.
- Rapid troubleshooting: Correlates logs, metrics, and traces to pinpoint issues quickly, reducing downtime.
- Proactive monitoring: Detects and responds to potential problems with robust alerting capabilities.
- Scalability and collaboration: Handles high volumes of data and facilitates cross-team collaboration, supporting large-scale environments.
Expert insights into the future of microservices architectures
Artificial intelligence (AI) and machine learning (ML) integration
The integration of AI and ML into monitoring tools is revolutionizing the way we manage microservices architectures. These technologies are providing significant advancements in several key areas:
- Predictive analytics: AI and ML algorithms analyze historical data to predict future trends and potential issues. This enables proactive management of resources and early detection of performance degradation, helping to prevent outages before they occur.
- Automated anomaly detection: Machine learning models can identify patterns and detect anomalies in real-time, significantly reducing the time needed to identify and respond to issues. This automated approach helps in quickly isolating problems that may be difficult for human operators to spot.
- Enhanced troubleshooting capabilities: AI-powered tools can perform root cause analysis by correlating data from various sources, providing detailed insights into the underlying causes of issues. This speeds up the troubleshooting process and ensures that problems are resolved more efficiently.
Serverless and cloud-native trends
The rise of serverless architectures and cloud-native technologies is transforming how applications are developed and deployed. These trends bring new challenges and opportunities for monitoring tools.
With serverless computing, the infrastructure management is abstracted away, leading to more dynamic and ephemeral environments. Monitoring tools must adapt by providing real-time visibility into these transient services and capturing metrics that are relevant to serverless workflows.
Cloud-native technologies, such as Kubernetes and containers, require monitoring solutions that can handle highly dynamic and scalable environments. Modern tools are designed to integrate seamlessly with these technologies, offering features like automatic discovery and real-time tracking of containerized applications.
End-to-end visibility
Comprehensive visibility across the entire microservices architecture is crucial for effective monitoring and management. Modern tools are addressing this need through advanced data collection (from sources including logs, metrics, and traces in real time) and integration techniques, ensuring that all aspects of the microservices architecture are monitored and providing a complete picture of system health.
Implementing your microservices monitoring solution with confidence with Liquid Web
As you navigate the intricacies of microservices, the choice of infrastructure plays an important role.
Liquid Web’s managed dedicated servers offer a powerful solution, providing the flexibility to install and configure any necessary software, including Docker, to meet your unique needs. This level of control and customization ensures that your monitoring tools and strategies can be tailored precisely to your requirements, maximizing performance and reliability.
For those looking to get started with Docker, we recommend checking out this detailed guide on how to install Docker on Linux (AlmaLinux).
By partnering with Liquid Web, you gain access to high-performance infrastructure, expert support, and a range of services designed to enhance your monitoring capabilities.
Use Liquid Web’s managed dedicated servers and their powerful infrastructure to drive your microservices architecture toward success.
