

 Mohammed Noufal
 Prometheus Node Exporter is a lightweight tool designed for Linux systems. It offers critical insights into machine-level metrics such as CPU usage, memory consumption, disk utilization, and network statistics.
Its importance today lies in providing essential monitoring capabilities for system administrators and DevOps teams, enabling them to detect performance issues, set alerting thresholds, and maintain optimal system health.
Prometheus Node Exporter is highly compatible with AlmaLinux, a RHEL-based distribution, allowing seamless integration into AlmaLinux environments. This compatibility ensures that organizations relying on AlmaLinux can leverage Node Exporter to enhance their system monitoring and maintain the reliability and efficiency of their infrastructure.
Key points to take away
There are some key takeaways and knowledge points gained from reading the content of this guide:
- Installing and configuring the Prometheus server
- Installing and configuring Prometheus Node Exporter
- Completing the Prometheus Node Exporter setup and configuration
- Updating Prometheus and all the related software components
- Uninstalling Prometheus and all the related software components
Prometheus Node Exporter setup and configuration procedures
In this article, you will learn about the installation and configuration of Prometheus Node Exporter on AlmaLinux. Once installed, we will review a number of settings after first verifying that everything is running as expected.
Prerequisites
Here are the required prerequisites to have in place prior to beginning the installation process:
- Operating system and version: AlmaLinux OS 8.
- Access on the server: Use root or sudo access to install Prometheus Node Exporter.
To install the Prometheus Node Exporter on AlmaLinux, please follow the steps documented in the following sections.
Step #1. Update the AlmaLinux system
Before installing the Prometheus Node Exporter on AlmaLinux, you must refresh the repository cache, applying the most recent updates. To update the AlmaLinux system, perform the following command:
sudo dnf updateStep #2. Create a user and directory for Prometheus
You will first create a new user, prometheus, followed by a new configuration and data directory for the Prometheus installation. You can use the following command to create the user:
sudo adduser -M -r -s /sbin/nologin prometheusThen, create a new configuration directory, /etc/prometheus, and the data directory, /var/lib/prometheus, for Prometheus:
sudo mkdir /etc/prometheus
sudo mkdir /var/lib/prometheus
Use the commands shown below to change the configuration and data folders with regard to the user prometheus:
sudo chown prometheus:prometheus /etc/prometheus
sudo chown prometheus:prometheus /var/lib/prometheus
Step #3. Install and configure the Prometheus server
This step will include manually installing the Prometheus monitoring system from a tarball or tar.gz file and configuring it. Choose the Prometheus version from the download page on the official website. In this article, we use the Prometheus 2.48.1 version.
3.1. Installing Prometheus on AlmaLinux
Before downloading the Prometheus, use the following command to set your working directory to /usr/src:
cd /usr/srcTo download Prometheus, use the following command:
wget https://github.com/prometheus/prometheus/releases/download/v2.48.1/prometheus-2.48.1.linux-amd64.tar.gzHere is the output:
[root@noufal ~]# cd /usr/src
[root@noufal src]#

[root@noufal src]#  wget https://github.com/prometheus/prometheus/releases/download/v2.48.1/prometheus-2.48.1.linux-amd64.tar.gz
--2024-01-06 03:22:05--  https://github.com/prometheus/prometheus/releases/download/v2.48.1/prometheus-2.48.1.linux-amd64.tar.gz
Resolving github.com (github.com)... 140.82.113.3
Connecting to github.com (github.com)|140.82.113.3|:443... connected.
HTTP request sent, awaiting response... 302 Found
---
---
Connecting to objects.githubusercontent.com (objects.githubusercontent.com)|185.199.108.133|:443... connected.
HTTP request sent, awaiting response... 200 OK
Length: 96267926 (92M) [application/octet-stream]
Saving to: 'prometheus-2.48.1.linux-amd64.tar.gz'

prometheus-2.48.1.linux-amd64.tar.gz                        100%[=========================================================================================================================================>]  91.81M   177MB/s    in 0.5s

2024-01-06 03:22:06 (177 MB/s) - 'prometheus-2.48.1.linux-amd64.tar.gz' saved [96267926/96267926]
After the download has finished, extract the Prometheus file using the following command:
tar -xf prometheus-2.48.1.linux-amd64.tar.gz Now, you can see a new directory prometheus-2.48.1.linux-amd64. Copy all Prometheus configuration files to the /etc/prometheus directory and the binary file prometheus to the directory /usr/local/bin. Then, set the environment variable PROM_SRC to the directory /usr/src/prometheus-* using the following command:
export PROM_SRC=/usr/src/prometheus-*Next, copy the Prometheus configuration file, prometheus.yml, to the directory /etc/prometheus using the following command:
sudo cp $PROM_SRC/prometheus.yml /etc/prometheus/Then, copy the Prometheus and Promtool binary files into the /usr/local/bin/ directory using the following commands:
sudo cp $PROM_SRC/prometheus /usr/local/bin/
sudo cp $PROM_SRC/promtool /usr/local/bin/
Now, you can copy the Prometheus console templates and libraries to the /etc/prometheus directory using the following commands:
sudo cp -r $PROM_SRC/consoles /etc/prometheus
sudo cp -r $PROM_SRC/console_libraries /etc/prometheus
3.2. Configuring Prometheus
To edit the Prometheus configuration file /etc/prometheus/prometheus.yml, use any text editor, such as nano:
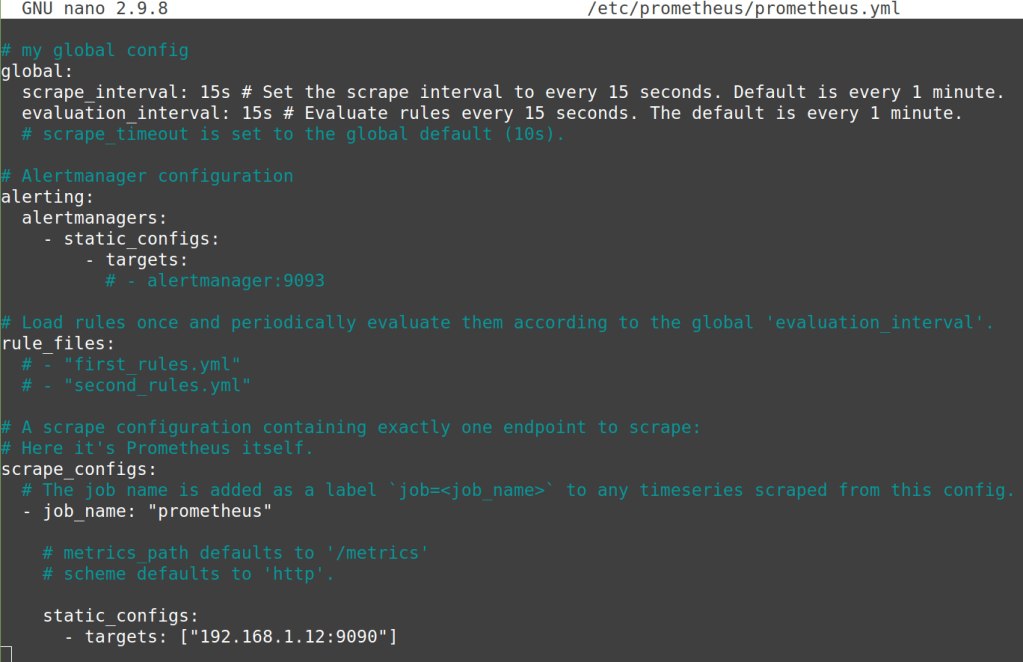
nano /etc/prometheus/prometheus.ymlYou may need to include monitoring jobs and instructions for scraping all data from the target in the scrape_configs option. The default configuration uses the default monitoring job name prometheus and the target server localhost via the static_configs option.
You can change the target from localhost:9090 to the server IP address 192.168.1.12:9090, as shown below:
scrape_configs:
  - job_name: "prometheus"
    static_configs:
      - targets: ["192.168.1.12:9090"]
Replace 192.168.1.12 with your server IP address. Then, save the configuration and exit. Here is the output:
3.3. Setting up Prometheus as a service
In this step, you will configure Prometheus as a systemd service. Make a new systemd service file with the name and directory path of /etc/systemd/system/prometheus.service with any text editor:
nano /etc/systemd/system/prometheus.serviceAdd the following details, then save the configuration and exit:
[Unit]
Description=Prometheus
Wants=network-online.target
After=network-online.target

[Service]
User=prometheus
Group=prometheus
Type=simple
ExecStart=/usr/local/bin/prometheus \
    --config.file /etc/prometheus/prometheus.yml \
    --storage.tsdb.path /var/lib/prometheus/ \
    --web.console.templates=/etc/prometheus/consoles \
    --web.console.libraries=/etc/prometheus/console_libraries

[Install]
WantedBy=multi-user.target
Here is the output:

Now, you can reload the associated systemd manager to apply a new configuration settings:
sudo systemctl daemon-reloadThen, use the following commands to start and enable the Prometheus service and check its status:
sudo systemctl enable --now prometheus
sudo systemctl status prometheus
Here is the output:
[root@noufal src]# sudo systemctl enable --now prometheus
Created symlink /etc/systemd/system/multi-user.target.wants/prometheus.service → /etc/systemd/system/prometheus.service.
[root@noufal src]#
[root@noufal src]# sudo systemctl status prometheus
● prometheus.service - Prometheus
   Loaded: loaded (/etc/systemd/system/prometheus.service; enabled; vendor preset: disabled)
   Active: active (running) since Sat 2024-01-06 03:41:52 UTC; 2s ago
 Main PID: 47851 (prometheus)
    Tasks: 7 (limit: 11852)
   Memory: 104.0M
   CGroup: /system.slice/prometheus.service
           └─47851 /usr/local/bin/prometheus --config.file /etc/prometheus/prometheus.yml --storage.tsdb.path /var/lib/prometheus/ --web.console.templates=/etc/prometheus/consoles --web.console.libraries=/etc/prometheus/console_libraries
Step #4. Allow the Prometheus port in the AlmaLinux firewall
To allow the Prometheus default port 9090 and reload the AlmaLinux firewall to reflect the changes, you can use the following commands:
sudo firewall-cmd --zone=public --add-port=9090/tcp --permanent
sudo firewall-cmd --reload
Step #5. Access the Prometheus web interface
The Prometheus monitoring tool is now accessible via TCP port 9090. Open the browser and type the server IP address and port 9090 in the address bar, for example, http://192.168.1.12:9090.
Replace the value of 192.168.1.12 with your server IP address. You can see the Prometheus Dashboard query below. Here is the output:

Step #6. Install and configure Node Exporter
Node Exporter can export metrics to a Prometheus server from Linux servers. This step will include manually installing Node Exporter from a tarball or tar.gz file and configuring it.
Choose the Node Exporter version from the download page on the official website. In this article, we use the Node Exporter 1.7.0 version.
6.1. Installing Node Exporter on AlmaLinux
Before downloading the Node Exporter, use the following command to set your working directory to /usr/src:
cd /usr/srcTo download Node Exporter, use the following command:
wget https://github.com/prometheus/node_exporter/releases/download/v1.7.0/node_exporter-1.7.0.linux-amd64.tar.gzHere is the output:
[root@noufal ~]# cd /usr/src
[root@noufal src]#
[root@noufal src]# wget  https://github.com/prometheus/node_exporter/releases/download/v1.7.0/node_exporter-1.7.0.linux-amd64.tar.gz

--2024-01-06 03:49:55--  https://github.com/prometheus/node_exporter/releases/download/v1.7.0/node_exporter-1.7.0.linux-amd64.tar.gz

Resolving github.com (github.com)... 140.82.114.4

Connecting to github.com (github.com)|140.82.114.4|:443... connected.

HTTP request sent, awaiting response... 302 Found
—-
—-
Connecting to objects.githubusercontent.com (objects.githubusercontent.com)|185.199.110.133|:443... connected.
HTTP request sent, awaiting response... 200 OK
Length: 10419253 (9.9M) [application/octet-stream]
Saving to: 'node_exporter-1.7.0.linux-amd64.tar.gz'

node_exporter-1.7.0.linux-amd64.tar.gz                      100%[=========================================================================================================================================>]   9.94M  --.-KB/s    in 0.06s

2024-01-06 03:49:55 (161 MB/s) - 'node_exporter-1.7.0.linux-amd64.tar.gz' saved [10419253/10419253]
After the download has finished, extract the Node Exporter file using the following command:
tar -xf node_exporter-1.7.0.linux-amd64.tar.gzNow, you can see a new directory node_exporter-1.7.0.linux-amd64. Using the following command, move the Node Exporter binary file to the directory /usr/local/bin:
mv node_exporter-*/node_exporter /usr/local/bin6.2. Setting up Node Exporter as a service
Before creating a Node Exporter systemd service file, create a new user, node_exporter. You can issue the following command to make the user for Node Exporter:
sudo adduser -M -r -s /sbin/nologin node_exporterThen, create a new systemd service file /etc/systemd/system/node_exporter.service with any text editor available on Linux:
sudo nano /etc/systemd/system/node_exporter.serviceAdd the following details, then save the configuration and exit:
[Unit]
Description=Node Exporter
After=network.target

[Service]
User=node_exporter
Group=node_exporter
Type=simple
ExecStart=/usr/local/bin/node_exporter

[Install]
WantedBy=multi-user.target
Here is the output:

Next, you are ready to reload the systemd manager, which will apply the new configuration:
sudo systemctl daemon-reloadThen, use the following commands to start and enable the Node Exporter service and check its status:
sudo systemctl enable --now node_exporter
sudo systemctl status node_exporter
Here is the output:
[root@noufal src]# sudo systemctl enable --now node_exporter
Created symlink /etc/systemd/system/multi-user.target.wants/node_exporter.service → /etc/systemd/system/node_exporter.service.
[root@noufal src]#
[root@noufal src]# sudo systemctl status node_exporter
● node_exporter.service - Node Exporter
   Loaded: loaded (/etc/systemd/system/node_exporter.service; enabled; vendor preset: disabled)
   Active: active (running) since Sat 2024-01-06 03:53:59 UTC; 5s ago
 Main PID: 48066 (node_exporter)
    Tasks: 4 (limit: 11852)
   Memory: 4.7M
   CGroup: /system.slice/node_exporter.service
           └─48066 /usr/local/bin/node_exporter
The Node Exporter is running on the default port 9100. Verify it using the following ss command:
ss -aplnt | grep nodeHere is the output:
[root@noufal src]# ss -aplnt | grep node
LISTEN 0      2048  *:9100  *:*    users:(("node_exporter",pid=48066,fd=3))
6.3. Adding Node Exporter to Prometheus
Once the Prometheus Node Exporter installation is finished, Node Exporter can be added to the Prometheus server. To edit the Prometheus configuration file /etc/prometheus/prometheus.yml using a text editor:
sudo nano /etc/prometheus/prometheus.ymlIn the scrape_config section, create a new job for the Node Exporter with the following details. Then, save the configuration and exit:
 - job_name: "node_exporter_metrics"
    scrape_interval: 5s
    static_configs:
      - targets: ["192.168.1.12:9100"]
Here is the output:

Step #7. Allow the Node Exporter port in the AlmaLinux firewall
To allow the Node Exporter default port 9100 and reload the AlmaLinux firewall to reflect the changes, you can use the following commands:
sudo firewall-cmd --zone=public --add-port=9100/tcp --permanent
sudo firewall-cmd --reload
Step #8. Verify that the Prometheus Node Exporter installation was successful
Click the Status tab and choose Targets from the Prometheus Dashboard. You will see two endpoints:
- prometheus
- node_exporter_metrics
Here is the output:

Once the Node Exporter has been installed and running, you can confirm that metrics are exported by accessing the server IP address with the /metrics endpoint, for example, http://192.168.1.12:9100/metrics. Here is the output:

Step #9. View the Prometheus Node Exporter metrics on the Prometheus Dashboard
Click the Graph or Table tab and enter the PromQL (Prometheus Querying Language) query into the search bar. Here are a couple of examples in the following sections.
9.1. PromQL example #1 query string example — node_os_info
Run the node_os_info query to get complete information on the operating system:

9.2. PromQL query string example #2— node_memory_MemFree_bytes
Run the node_memory_MemFree_bytes query to get details about the amount of free system memory:

How to update Prometheus and all the related software components
In this article, we will update Prometheus from the Prometheus 2.48.1 version to Prometheus 2.50.1 version and Node Exporter from the Node Exporter 1.7.0 version to the Node Exporter 1.8.0 version. To update Prometheus and all the related software components, follow the steps laid out in the next sections.
Step #1. Back up the Prometheus configuration details and data
To back up the Prometheus configuration details and data, use the following command:
sudo cp -r /etc/prometheus /etc/prometheus_backupStep #2. Stop the Prometheus service
To stop the Prometheus service, use the following command:
sudo systemctl stop prometheusStep #3. Download and extract the new Prometheus version
To download the new Prometheus version, use the following command:
wget https://github.com/prometheus/node_exporter/releases/download/v1.8.0/node_exporter-1.8.0.linux-amd64.tar.gzTo extract the new Prometheus version, use the following command:
tar -xf prometheus-2.50.1.linux-amd64.tar.gzStep #4. Replace the binary and configuration files
To replace the Prometheus binary files, use the following command:
mv prometheus-2.50.1.linux-amd64/prometheus /usr/local/bin/To replace the Prometheus configuration file, use the following command:
cp prometheus-2.50.1.linux-amd64/prometheus.yml /etc/prometheus/Replace prometheus-2.50.1.linux-amd64 with the new Prometheus version.
Step #5. Start the Prometheus service
To start the Prometheus service, use the following command:
sudo systemctl start prometheusStep #6. Back up Node Exporter configuration details and data
To back up the Node Exporter configuration details and data, use the following command:
cp /etc/systemd/system/node_exporter.service /etc/systemd/system/node_exporter.service_backupStep #7. Download and extract the new Node Exporter version
To download the new Node Exporter version, use the following command:
wget https://github.com/prometheus/node_exporter/releases/download/v1.8.0/node_exporter-1.8.0.linux-amd64.tar.gzTo extract the new Node Exporter version, use the following command:
tar -xf node_exporter-1.8.0.linux-amd64.tar.gzStep #8. Replace the Node Exporter binary file
To replace the Node Exporter binary file, use the following command:
mv node_exporter-1.8.0.linux-amd64/node_exporter /usr/local/bin/Step #9. Start the Node Exporter service
To start the Node Exporter service, use the following command:
sudo systemctl start node_exporterHow to uninstall Prometheus and all the related software components
To uninstall Prometheus and related software components, please follow the steps provided in the following sections.
Step #1. Stop the Prometheus Node Exporter services
To stop the Prometheus Node Exporter services, use the following commands:
sudo systemctl stop prometheus
sudo systemctl stop node_exporter
Step #2. Remove the Prometheus Node Exporter binary files
To remove the Prometheus Node Exporter binary files, issue the following commands:
sudo rm /usr/local/bin/prometheus
sudo rm /usr/local/bin/node_exporter
Step #3. Remove the Prometheus configuration files
To remove the Prometheus configuration files, use the following command:
sudo rm -r /etc/prometheus/Recursive, or the –r flag, will remove the directories and everything within them.
Step #4: Remove the Prometheus Node Exporter service configuration
To remove the Prometheus Node Exporter service configuration files, use the following commands:
sudo rm /etc/systemd/system/prometheus.service
sudo rm /etc/systemd/system/node_exporter.service
Step #5. Reload systemd and clean up
To reload systemd and clean up any remaining configurations, use the following commands:
sudo systemctl daemon-reload
sudo systemctl reset-failed
About a machine’s health and performance as represented with system-level metrics
Prometheus Node Exporter captures various system-level metrics to provide information about a machine’s health and performance. These data elements are exposed in a such a way so that Prometheus can scrape, gather, assemble and present them for system admins to review.
Here are some standard metrics related to the system information collected by Node Exporter. These are only a few of the many metrics provided by Node Exporter. The official Node Exporter documentation describes many more metrics available.
CPU metrics
Here the data points related to CPU metrics:
- node_cpu_seconds_total — the CPU has spent a cumulative total of seconds in each mode (user, system, idle, etc.).
- node_cpu_seconds_total{mode=”idle”} — total CPU time spent in idle mode.
Memory metrics
Here the data elements related to memory metrics:
- node_memory_MemTotal_bytes — the total system memory.
- node_memory_MemFree_bytes — the amount of free system memory.
- node_memory_Cached_bytes — the amount of memory used for caching data.
Network metrics
Here the data values related to network metrics:
- node_network_receive_bytes_total — total bytes received on all network interfaces.
- node_network_transmit_bytes_total — total bytes transmitted on all network interfaces.
- node_network_receive_bytes{device=”eth0″} — bytes received on a specific network interface.
Disk I/O metrics
Here the data points related to disk I/O metrics:
- node_disk_io_time_seconds_total — cumulative seconds spent doing I/Os.
- node_disk_io_time_seconds_total{device=”sda”} — cumulative seconds spent doing I/Os on a specific disk.
Filesystem metrics
Here the data elements related to filesystem metrics:
- node_filesystem_size_bytes — total size of the filesystem.
- node_filesystem_free_bytes — free space on the filesystem.
Uptime metrics
Here the data value related to uptime metrics:
- node_boot_time_seconds — the timestamp when the node was last booted.
System load metrics
Here the data points related to system load metrics:
- node_load1 — the 1-minute load averages.
- node_load5 — the 5-minute load averages.
- node_load15 — the 15-minute load averages.
Filesystem read/write metrics
Here the data elements related to filesystem read/read metrics:
- node_filesystem_read_bytes_total — total bytes read from all filesystems.
- node_filesystem_write_bytes_total — total bytes are written to all filesystems.
Closing thoughts
Installing Prometheus Node Exporter on AlmaLinux is a simple process that improves system monitoring capabilities. Users can easily add Node Exporter to their AlmaLinux system by following the steps mentioned in this article, providing vital metrics and insights for optimal performance management. This small but powerful tool contributes to a comprehensive monitoring ecosystem, allowing administrators to make intelligent choices and keep their systems running smoothly.
Get started with Liquid Web
For an easy Prometheus Node Exporter installation on AlmaLinux, we recommend contacting Liquid Web’s dedicated support and utilizing our managed hosting services. Our experienced support team is familiar with Liquid Web products and offers personalized help to enable a smooth integration of Prometheus Node Exporter.
Managed hosting services provide a robust infrastructure and proactive monitoring, security, and optimization tailored to your requirements. Trust our full technical assistance and managed services to simplify the deployment process, allowing you to focus on using Prometheus for effective system monitoring. At the same time, we handle the hosting and support aspects.